Difficulty Navigating Cost Obligations Adds to Healthcare Affordability Woes in Connecticut
A 2018 survey of more than 900 Connecticut adults found that state residents face heavy healthcare affordability burdens and that affording healthcare in the future is a top consumer concern.1 Using data from the same survey, this data brief assesses Connecticut residents’ confidence with respect to navigating the health system and fulfilling their cost-sharing obligations.
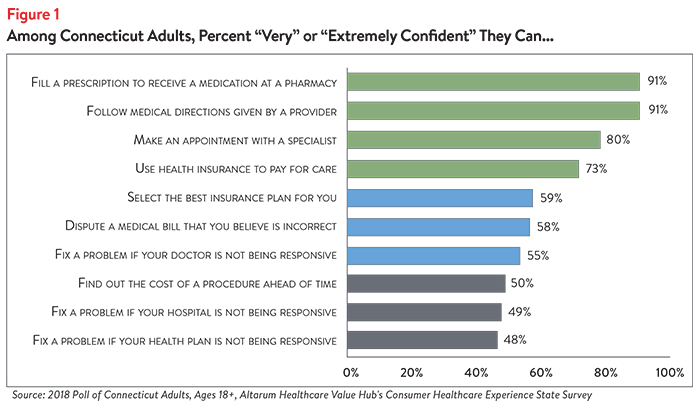
Out of 10 healthcare tasks, Connecticut residents have the least confidence in their abilities to correct billing and work with their doctor, hospital or health plan to resolve problems. Connecticut residents report being confident that they can fill a prescription or follow the directions provided by their doctor. They are less confident when dealing with cost issues, such as disputing a medical bill error or finding the cost of a procedure ahead of time. Fewer than half of Connecticut adults are confident they can take steps to fix a problem if their doctor, hospital or health plan is not responsive to their concerns (Figure 1).
All-in-all, some respondents revealed that they feel more confident they can navigate the healthcare system than afford the care they receive. For example, only 58% were somewhat or very confident that they could afford to pay for a major illness.2
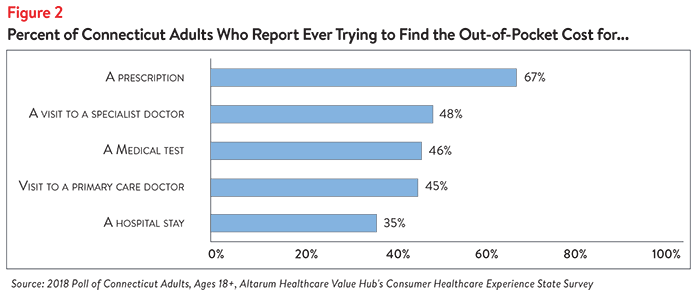
About Half of Connecticut Residents Have Tried to Find the Price of Healthcare Services. Nearly half of all Connecticut adults surveyed have tried to find out their out-of-pocket cost for a doctor visit or medical test. Seeking the cost of a hospital stay was somewhat less frequent, while seeking the price of a prescription drug was more frequent (Figure 2).
Fifty-eight percent of respondents who sought prices report only performing this activity once or twice. Thirty-nine percent of respondents who sought prices report that they sought prices in order to compare two or more services—a rate higher than previously observed in national surveys.3
For the portion of patients who did compare two prices, 70% report that they were successful.
Health Plan Cost-Sharing Terms are Difficult to Understand
Despite this price seeking behavior, consistently understanding healthcare cost-sharing obligations remains challenging for Connecticut adults.
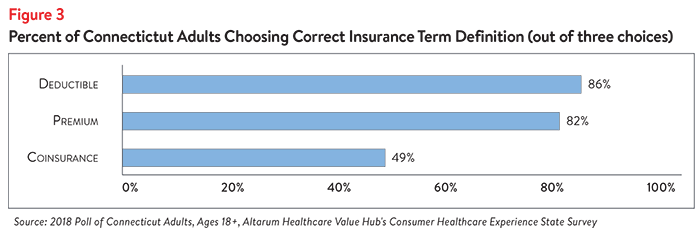
Respondents of the Connecticut poll were able to identify the correct definitions for “premium” and “deductible” more than 80% of the time, but less than half had an accurate understanding of “coinsurance” (Figure 3).
This comports with several national studies which have found that health plan cost sharing terms are difficult for consumers to understand. Reasons include complex insurance rules, poor numeracy skills and poor literacy skills.4 Information related to patients’ out-of-pocket costs was rated as the most challenging to find and understand out of all healthcare information.5
Unfortunately, national data also suggest that consumers are not good self-reporters when it comes to assessing their skills. Myriad studies show that confidence exceeds actual skills, particularly when it comes to applying health insurance cost-sharing rules to understand the amount that patients have to pay.6
Difficulty understanding coinsurance or other cost-sharing terms may make it harder for consumers to be informed shoppers and to anticipate out-of-pocket costs.
Unexpected Medical Bills are Common
Surprise medical bills are very common. Altogether, 33% of Connecticut adults reported receiving an unexpected medical expense in the prior 12 months. The rate was highest among people with private insurance purchased on their own or through their employer (39%), compared to those with Medicare (26%) or Medicaid (21%).
Thirty-nine percent of privately-insured Connecticut adults received an unexpected expense on a medical bill. These unexpected bills take different forms. Of those privately-insured patients that received unexpected bills:
- 22%—reported that the amount charged was higher than expected
- 13%—reported receiving a bill from a doctor they didn’t expect
Smaller numbers reported being charged out-of-network rates when they thought the doctor was in-network (5%); being charged for services they did not receive (2%) or experiencing something else unexpected (5%).
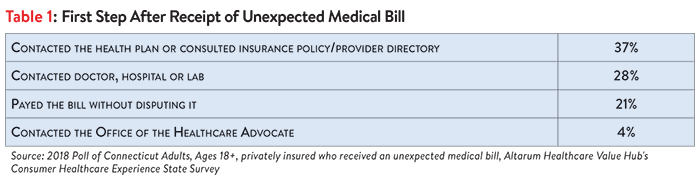
Connecticut residents with private health insurance tried to address the surprise bill but were often not satisfied with the resolution. Fully three-quarters (79%) of Connecticut residents with private health insurance who received a surprise bill made an effort to resolve the bill before paying it. As a first step, a large portion of these respondents contacted the doctor, hospital or lab to resolve their unexpected medical bill (Table 1).
Just 20% of privately insured Connecticut adults took more than one step to resolve the unexpected bill. Either as a first or second step, very few reported using any of the following strategies to resolve their bill:
- Contacting an insurance broker
- Filing an insurance appeal
- Contacting state legislators or member of Congress
- Contacting a lawyer
- Filing a formal complaint
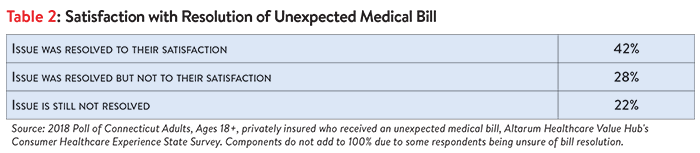
Fifty percent of privately insured patients unhappy with the resolution of their unexpected bill or reported the bill was not yet resolved. Among privately insured Connecticut adults who received an unexpected medical bill, many indicated that the issue was resolved to their satisfaction. However, a greater portion indicated that the issue was either not resolved to their satisfaction or not resolved at all (Table 2).
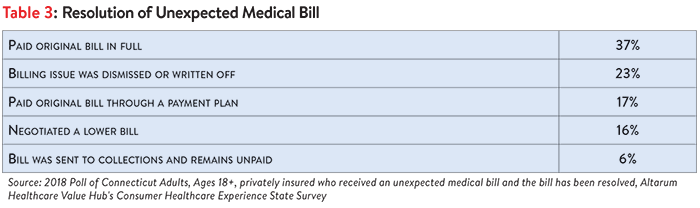
For those whose bill was resolved by the time of the survey, most paid the bill in full or through a payment plan. A large minority got relief from the bill, either by negotiating a lower bill or having the bill dismissed (Table 3). Six percent had their bill sent to collections.7
In roughly equal numbers, both satisfied and dissatisfied consumers with private health insurance report attempting to contact their health plan to resolve the unexpected bill. But consumers satisfied with how their medical bill was resolved were somewhat more likely to have tried other strategies such as contacting the doctor, hospital or lab or an insurance broker. In contrast, consumers dissatisfied with how their medical bill was resolved more often reported paying their bill without disputing it, asking a friend or family member for help or filing an appeal.
Perhaps not surprisingly, those that felt satisfied with how their medical bill was resolved were more likely to have either negotiated a lower payment or had their bill written off or dismissed.
Confidence Navigating Healthcare Varies by Income
When the survey data is disaggregated by income, we see that lower income families had lower levels of confidence than high income families when it comes to disputing a medical bill error or taking steps to fix it if their doctor, hospital or health plan is not responsive to their problem (Figure 4).
All income groups experience surprise medical bills at roughly the same rate. Among the privately insured, lower-income families experience surprise medical bills (32%) as often as high-income families (32%). Families in the mid-tier income level experienced the highest level of surprise medical bills at 39%. However, lower income families had lower satisfaction and more often had medical bills sent to collections than any other income group.
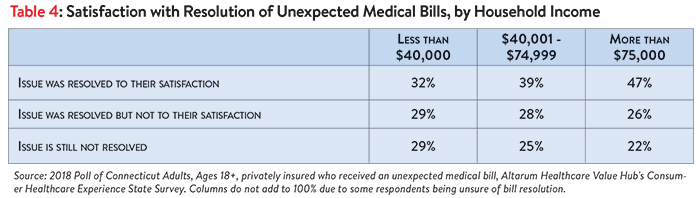
Unresolved surprise medical bills were more prevalent among lower income respondents. Privately insured bill recipients with incomes over $75K report the highest rate of satisfaction with the resolution of their surprise medical bill. Lower income respondents had the smallest rate of satisfaction and were most likely to have their surprise bill unresolved at the time of the survey (Table 4).
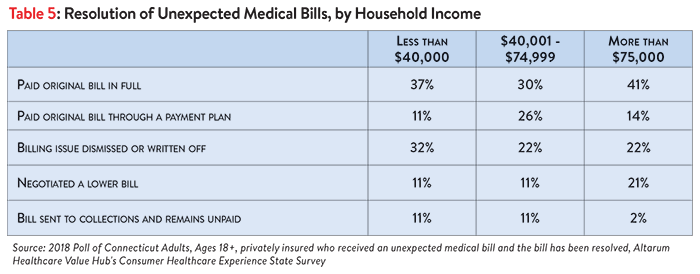
Privately insured Connecticut respondents reported large differences with respect to their surprise medical bill’s resolution, by income level. The majority of upper income levels reported ultimately paying the surprise bill in full or through a payment plan and were unlikely to have the bill sent to collections. This group was also more successful in negotiating a lower bill. While a fair number (48%) of lower income respondents also reported paying the surprise bill, lower and middle income respondents reported more often allowing bills to go to collections, and infrequently being able to negotiate a lower bill. Families making less than $40K did report the comparatively high frequency of having the billing issue written off or dismissed (Table 5).
Discussion
While Connecticut residents report being confident they can fill a prescription or follow the directions provided by their doctor, and demonstrate a willingness to seek out price information selectively, they also report lacking confidence in certain skills needed to navigate the healthcare system. The most common struggles reported include an inability to successfully dispute medical bills and resolve problems with unresponsive providers and health plans.
One way these difficulties manifest themselves is alarmingly high rates of unexpected medical bills. Approximately 40 percent of privately-insured Connecticut adults reported receiving a medical bill that included an unexpected expense in the prior 12 months. Surprise medical bills take many forms, from charges higher than expected, to bills from doctors patients didn’t expect, to unexpected out-of-network bills. Distressingly, over one-quarter of these unexpected bills are not resolved to the satisfaction of the recipient.
Privately insured consumers who received these surprise bills report taking just one—or no—action to resolve their bill. Respondents who did take an action—such as contacting their health plan, doctor or hospital—almost never escalated their efforts to include contacting the Office of the Healthcare Advocate, filing an appeal or other possible steps.
Struggles to navigate the health system vary by household income, with lower income families reporting less confidence in their abilities to dispute or address problems. Among the privately insured, lower income families receive surprise medical bills at roughly the same rate as higher income families. However, they report somewhat lower rates of satisfaction with the resolution and greater rates of the bill going to collections.
Since 2016, Connecticut has had protections in place for one type of unexpected medical bill. If patients with coverage they purchased on their own of through a small employer receive a “surprise bill” from a health insurer for out-of-network services provided at an in-network facility, they are only held responsible for paying the cost-sharing that would apply if the services had been provided by an in-network provider. Moreover, Medicaid and Medicare have basic prohibitions against “balance billing” by providers that accept these types of coverage.
These Connecticut findings are consistent with other data showing that many adults have a poor understanding of how to navigate financial aspects of the healthcare system, and lack critical knowledge like knowing they have the right to appeal a coverage decision, how to seek help from state regulators and how to navigate hospital charity care policies.8
Industry trends suggest things may not improve in the short term. The increasing prevalence of high deductible health plans, use of coinsurance,9,10 narrow provider networks and other measures intended to rein in premium growth, are making our health system ever more difficult for families to navigate and opening them up to financial harm. Moreover, the evidence is strong that high deductible health plans are not successful in driving better value in the healthcare marketplace.11
In light of the health and financial harm that arises when consumers cannot understand or anticipate their out-of-pocket costs, policyholders and other stakeholders should consider actions to make the health system easier to navigate. These include: reducing the likelihood of encountering pricing or quality outliers; simplifying and standardizing cost-sharing benefit designs;12 moving away from high-deductible plan designs and considering different approaches to reining in premium growth;13 and increasing/promoting live, hands-on assistance navigating insurance issues.14 Evidence to-date suggests that making structural changes like these are likely to yield better results than consumer educational efforts alone.
Notes
1. See: Healthcare Value Hub, Connecticut Residents Struggle to Afford High Healthcare Costs; Express Across Party Lines Support for a Range of Government Solutions, Data Brief No. 2 (October 2018).
2. Ibid.
3. Nationally, just 20% of Americans have tried to compare prices across multiple providers before getting care. Still Searching: How People Use Health Care Price Information in The United States, Public Agenda (April 6, 2017). The comparable rate for this Connecticut survey is 30% (those who compared prices as a percent of all Adults).
4. Long, S., et al., Low Levels of Self-Reported Literacy and Numeracy Create Barriers to Obtaining and Using Health Insurance Coverage, Urban Institute (October 2014).
5. Duke, Chris, The Challenge of Communicating Health Care Information Effectively, Altarum (Aug. 22, 2016) and Quincy, Lynn, What’s Behind the Door: Consumers’ Difficulties Selecting Health Plans, Consumers Union (January 2012).
6. Paez, Kathryn, and Coretta, Mallery, A Little Knowledge Is a Risky Thing: Wide Gap in What People Think They Know About Health Insurance and What They Actually Know, American Institute for Research (October 2014) and Loewenstein, George, et al., “Consumers’ Misunderstanding of Health Insurance,” Journal of Health Economics (June 26, 2013).
7. Across all types of medical bills–expected and unexpected–involvement of a collection agency was common. Ten percent of ALL Connecticut adults have been contracted by a collection agency over a medical bill in the prior 12 months. See: Healthcare Value Hub, Connecticut Residents Struggle to Afford High Healthcare Costs; Support a Range of Government Solutions Across Party Lines, Data Brief No. 2 (October 2018).
8. A 2014 Kaiser Family Foundation survey found one-third of respondents did not know that if a health plan refuses to pay for a medically recommended service, an insured person has the right to appeal the plan’s decision. https://www.kff.org/health-reform/poll-finding/assessing-americans-familiarity-with-health-insurance-terms-and-concepts/. A separate 2015 survey found three-quarters of privately-insured adults are unsure if they have the further right to appeal to the state/an independent medical expert if their health plan refuses coverage for medical services they think they need. Few (just 13%) could identify the state agency/department tasked with handling health insurance complaints. https://consumersunion.org/research/surprise-bills-survey/
9. Kaiser Family Foundation, 2017 Employer Health Benefits Survey. Available at: https://www.kff.org/report-section/ehbs-2017-section-7-employee-cost-sharing/
10.Pearson, C., Majority of Drugs Now Subject to Coinsurance in Medicare Part D Plans, Avalere. Available at: http://avalere.com/expertise/managed-care/insights/majority-of-drugs-now-subject-to-coinsurance-in-medicare-part-d-plans
11.Healthcare Value Hub, Rethinking Consumerism in Healthcare Benefit Design, Research Brief No. 11 (April 2016).
12.Healthcare Value Hub, strategy page on Standard Health Plan Designs. https://healthcarevaluehub.org/improving-value/browse-strategy/standard-health-plan-designs/
13.Healthcare Value Hub, Rethinking Consumerism in Healthcare Benefit Design, Research Brief No. 11 (April 2016).
14.Healthcare Value Hub, The Office of the Healthcare Advocate: Giving Consumers a Seat at the Table, Research Brief No. 25 (April 2018, updated May 2018).
Methodology
Altarum’s Consumer Healthcare Experience State Survey (CHESS) is designed to elicit respondents’ unbiased views on a wide range of health system issues, including confidence using the health system, financial burden and views on fixes that might be needed.
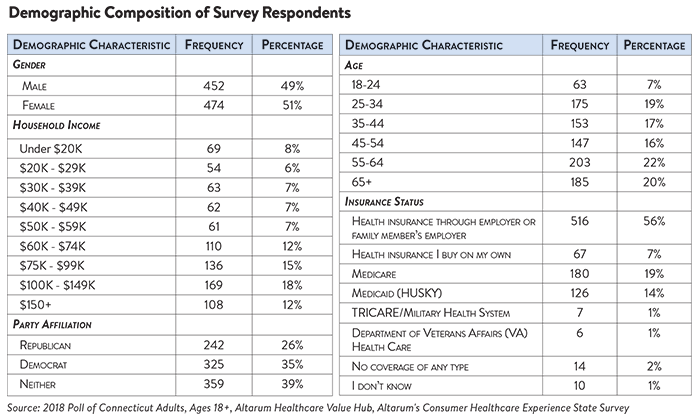
The survey used a web panel from SSI Research Now with a demographically balanced sample of approximately 1,000 respondents who live in Connecticut. The survey was conducted only in English and restricted to adults ages 18 and older. Respondents who finished the survey in less than half the median time were excluded from the final sample, leaving 926 cases for analysis. After those exclusions, the demographic composition of respondents can be found in the table below. Additional information on the survey instrument is available upon request by emailing hubinfo@altarum.org.

HEALTHCARE VALUE HUB
The Healthcare Value Hub can help you find free, timely information about policies and practices to achieve health systems that are equitable, affordable, and focused on the goals and needs of the people the system is meant to serve.
Share
![]()
![]()
![]()

Follow
![]()
![]()


![]()