Difficulty Understanding Cost Obligations Adds to Healthcare Affordability Woes in Kentucky
A 2018 survey of more than 900 Kentucky adults found that Kentuckians current healthcare affordability burdens and that affording healthcare in the future is one of their top worries.1 Using data from the same survey, this data brief explores how confident Kentuckians are with respect to navigating the health system and understanding their cost-sharing obligations.
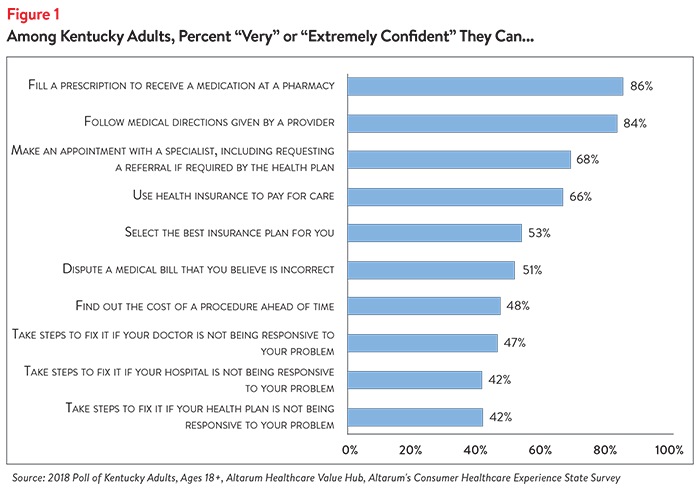
Out of 10 tasks, Kentuckians have the least confidence when it comes to correcting billing or working with their doctor, hospital or health plan to solve problems.
Kentuckians report being confident they can fill a prescription or follow the directions provided by their doctor. At the other end of the spectrum are the tasks of disputing a medical bill error or taking steps to fix it if their doctor, hospital or health plan is not responsive to their problem. Fewer than half of Kentucky adults are confident they can do the latter tasks (see Figure 1).
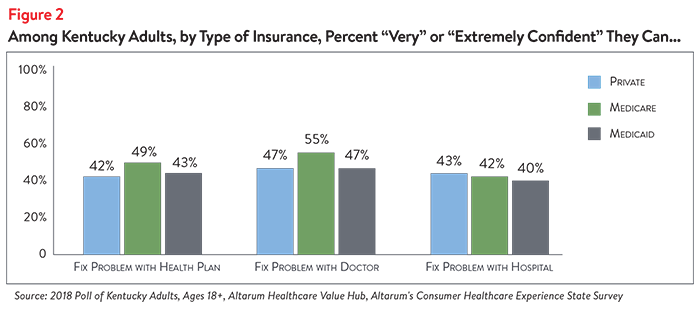
For the most difficult tasks, respondents report consistently low rates of confidence, regardless of insurance type (see Figure 2).
These data are consistent with another survey finding that showed privately insured Kentucky respondents often took no actions after receiving an unexpected medical bill.2 Respondents who did take an action—such as contacting their health plan, doctor or hospital—almost never escalated their efforts to include contacting state consumer assistance offices, filing an appeal, or other steps. Many reported being dissatisfied with the resolution.
Respondents revealed they feel more confident that they can navigate the healthcare system than afford the care they receive. For example, only 44% were somewhat or very confident that they could afford to pay the bills for a major illness.3
Health Plan Cost-Sharing Terms are Difficult to Understand
Several national studies have found that health plan cost sharing terms are difficult for consumers to understand. Reasons include complex insurance rules, poor numeracy skills and poor literacy skills.4 Information related to patients’ out-of-pocket costs was rated as the most challenging to find and understand out of all healthcare information.5
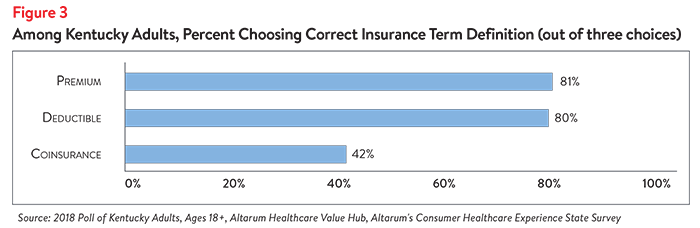
The Kentucky poll revealed that respondents were able to choose the correct definitions for Premium and Deductible 80% of the time, but less than half had an accurate understanding of Coinsurance (see Figure 3).
Confidence May Overstate Abilities
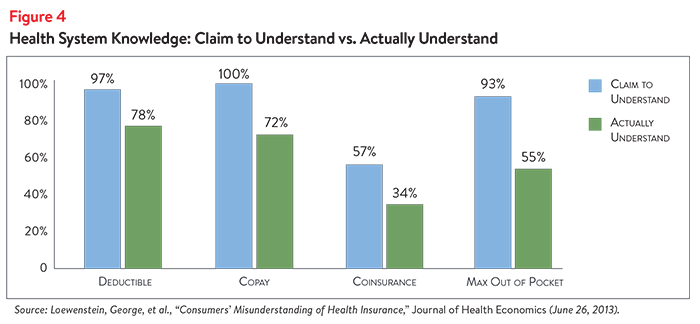
Unfortunately, national data suggests that consumers are not good self-reporters when it comes to assessing their skills. Myriad studies, like the one in Figure 4, show that confidence typically exceeds actual skills, particularly when it comes to applying insurance cost-sharing rules to understand the amount patients have to pay.6
Relationship Between Quality and Price
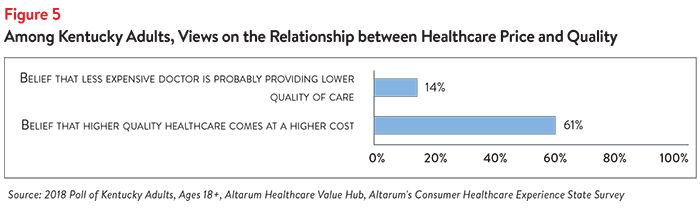
In light of well-documented, wide-spread variation in clinical quality and price,7 it is clear that consumers can benefit if they can successfully identify providers and treatment options that are of “good value.” Furthermore, studies show that there is little relationship between the quality and price of a medical service.8 This survey investigated respondents’ own views on the relationship between the quality and price.
More than half of Kentucky adults (61%) believe that higher quality healthcare usually comes at a higher cost. Yet very few believe that prices reliably signal the quality of care. Just 14% believe that a less expensive doctor is likely providing lower-quality care (see Figure 5).
Both cost and quality are important to Kentucky’s healthcare consumers. More than half of Kentucky adults (55%) indicated that if two doctors or healthcare providers had equal quality ratings, out-of-pocket costs would be a very or extremely important factor in deciding between the two professionals. Conversely, 55% of respondents indicated that if two doctors’ out-of-pocket costs were equal, quality ratings would be a very or extremely important factor in deciding between the two professionals.
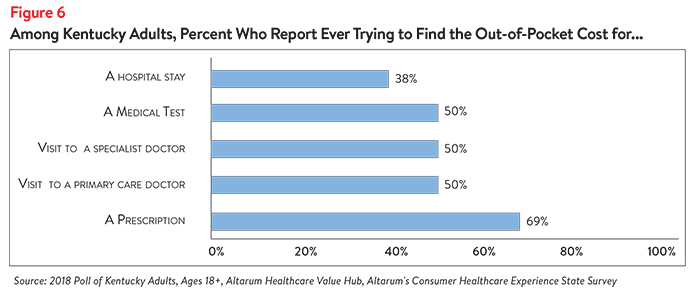
Kentuckians Tried to Find the Price of Healthcare Services
Roughly half of all Kentucky adults surveyed have tried to find out what their out-of-pocket cost would be for a doctor visit or medical test. Seeking the cost of a hospital stay was somewhat less frequent than average, while seeking the cost of a prescription drug more frequent (see Figure 6).
A majority of respondents (61%) who tried to determine out-of-pocket costs reported doing so only once or twice. However, 46% of these shoppers report that they sought prices in order to compare two or more services—a rate far higher than previously observed in national surveys.9
What is also surprising is that these “shoppers” report high rates of success in finding the prices they need. Of those who tried to compare two or more prices, 64% report that they were successful. National data suggest most consumers often struggle to obtain a price for a medical service.10
Discussion
Kentucky residents are knowledgeable about the relationship between the cost and quality of healthcare and are largely willing to seek out-of-pocket cost data. Yet, they also report lacking confidence in other skills needed to navigate the health system.
The most common navigational challenges include: disputing medical bills or resolving other problems with their doctors, hospitals and health plans; learning prices ahead of time; and using their health plans to pay for needed care. These challenges do not vary substantially by insurance type, suggesting that these difficulties are universal among Kentucky adults.
Low understanding of coinsurance and other cost-sharing obligations contribute to the receipt of “surprise medical bills”11 and worsen affordability burdens and worries of insured consumers.12
Difficulties navigating the health system are sometimes attributed to low levels of health insurance literacy, defined as:
Nationally, very low levels of health insurance literacy have been identified, with self-reported skills exceeding actual ability. Inadequate health literacy (a closely related concept) has been associated with poorer outcomes, lower patient satisfaction and higher costs.14
Consumer harm that results from difficulty navigating the health system can be addressed in numerous ways. Evidence to date suggests that simplifying eligibility, benefit design and other aspects of our health system are likely to yield better results than educational efforts alone. Simplification strategies that have been tried in other states include:
- reducing the likelihood of encountering pricing or quality outliers;15
- simplifying and standardizing cost-sharing benefit designs;16
- providing “nudges” like integrated provider directories, quality rankings, out-of-pocket calculators at the point of health plan shopping;
- providing live, hands on assistance navigating insurance issues; and
- deploying “universal precautions” in communications.
To the extent that the health system remains complex, consumers have signaled a preference for live, just-in-time consumer assistance over passive educational materials.17 A few states have developed a one-stop shop for helping consumers address denied claims or other difficulties.18
Notes
1. Healthcare Value Hub, Kentucky Residents Struggle to Afford High Healthcare Costs; Express Bipartisan Support for a Range of Government Solutions, Data Brief No. 7 (May 2018). https://healthcarevaluehub.org/advocate-resources/kentucky-2018-state-survey/
2. Healthcare Value Hub, Many Privately-Insured Kentuckians Receive Unexpected Medical Bills; Nearly One-Quarter Unhappy with Resolution; May Not Understand Options for Assistance, Data Brief No. 13 (August 2018).
3. For more on Kentuckian’s healthcare worries, see Healthcare Value Hub, Kentucky Residents Struggle to Afford High Healthcare Costs; Express Bipartisan Support for a Range of Government Solutions, Data Brief No. 7 (May 2018).
4. Long, S., et al., Low Levels of Self-Reported Literacy and Numeracy Create Barriers to Obtaining and Using Health Insurance Coverage, Urban Institute (October 2014).
5. Duke, Chris, The Challenge of Communicating Health Care Information Effectively, Altarum (Aug. 22, 2016); Quincy, Lynn, What’s Behind the Door: Consumers’ Difficulties Selecting Health Plans, Consumers Union (January 2012).
6. Paez, Kathryn, and Coretta Mallery, A Little Knowledge Is a Risky Thing: Wide Gap in What People Think They Know About Health Insurance and What They Actually Know, American Institute for Research (October 2014); Loewenstein, George, et al., “Consumers’ Misunderstanding of Health Insurance,” Journal of Health Economics (June 26, 2013).
7. See, for example, the data available at: http://www.healthcarepricingproject.org/
8. Hussey, P., Wertheimer, S., and Mehrotra, A., “The Association Between Health Care Quality and Cost: A Systematic Review,” Annals of Internal Medicine (2013).
9. Nationally, just 20 percent of Americans have tried to compare prices across multiple providers before getting care. Public Agenda, Still Searching: How People Use Health Care Price Information in the United States (April 6, 2017). The comparable rate for this Kentucky survey is 30% (those who compared prices as a percent of all Adults).
10. See, for example, Safiyyah, et al., “Changes in Ability of Hospitals to Provide Pricing for Total Hip Arthroplasty From 2012 to 2016,” JAMA Internal Medicine (2018).
11. Healthcare Value Hub, Many Privately-Insured Kentuckians Receive Unexpected Medical Bills; Nearly One-Quarter Unhappy with Resolution; May Not Understand Options For Assistance, Data Brief No. 13 (August 2018).
12. Healthcare Value Hub, Kentucky Residents Struggle to Afford High Healthcare Costs; Express Bipartisan Support for a Range of Government Solutions, Data Brief No. 7 (May 2018).
13. Measuring Health Insurance Literacy: A Call to Action, A Report from the Health Insurance Literacy Expert Roundtable, Consumers Union, University of Maryland College Park, American Institutes for Research (February 2012).
14. See, for example, https://www.sciencedirect.com/science/article/pii/S0197457216302981
15. Vestal, Christine, One State’s Hospital Cost Solution: Regulated Prices, Pew Charitable Trusts (March 29, 2011).
16. https://healthcarevaluehub.org/improving-value/browse-strategy/standard-health-plan-designs/
17. Tolbert Jennifer, et al., Connecting Consumers to Coverage: Lessons Learned from Assisters for Successful Outreach and Enrollment, Kaiser Family Foundation (Sept. 19, 2014).
18. Healthcare Value Hub, The Office of the Healthcare Advocate: Giving Consumers a Seat at the Table, Research Brief No. 25 (April 2018).
Methodology
Altarum’s Consumer Healthcare Experience State Survey (CHESS) is designed to elicit respondents’ unbiased views on a wide range of health system issues, including confidence using the health system, financial burden, and views on fixes that might be needed.
The survey used a web panel from SSI Research Now with a demographically balanced sample of approximately 1,000 respondents who live in Kentucky. It was conducted only in English and restricted to adults ages 18 and older.
Respondents who finished the survey in less than half the median time were excluded from the final sample, leaving 924 cases for analysis.
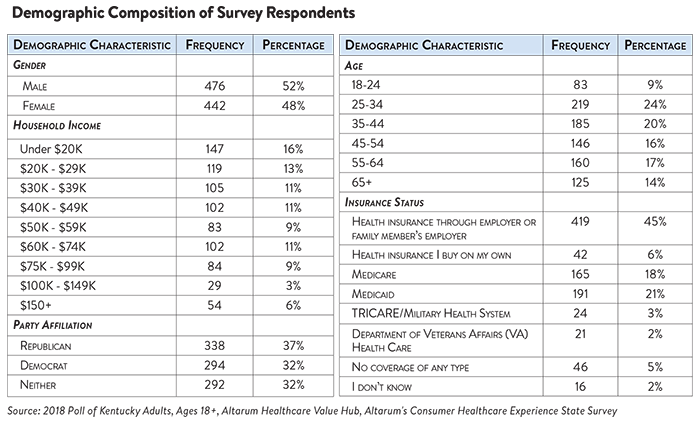
After those exclusions, the demographic composition of privately insured respondents is shown in the table below. Additional information on the survey instrument is available upon request by emailing hubinfo@altarum.org.

Kentucky Survey Reports
2020
Statewide
Statewide Affordability Report
Regional
2018
Statewide
Statewide Affordability Report
Difficulties Navigating Healthcare
Regional
Report Download
|
HEALTHCARE VALUE HUB
The Healthcare Value Hub can help you find free, timely information about policies and practices to achieve health systems that are equitable, affordable, and focused on the goals and needs of the people the system is meant to serve.
Share
![]()
![]()
![]()

Follow
![]()
![]()


![]()