

< View All Healthcare Value Hub Articles
Washington Survey Respondents Struggle to Afford High Health Care Costs; Worry about Affording Health Care in the Future; Express Bipartisan Support for Policy Solutions
Related Files
 WA 2025 Affordability Brief
Summary
A survey of more than 1,380 Washington adults, conducted from September 9 to October 8, 2025, found:
- Over 2 in 3 (68%) experienced at least one health care affordability burden in the past year;
- 4 in 5 (79%) worry about affording health care in the future;
- Over 2 in 3 (66%) of all respondents delayed or went without health care due to cost in the last twelve months;
- Over two in three (71%) of respondents believe the health care system is unaffordable
- Low and middle-income respondents and respondents with a disability or living in a household with a person with a disability reported higher rates of going without care due to cost and incurring medical debt, depleting savings, and/or sacrificing basic needs due to medical bills; and
- Across party lines, respondents express strong support for policy-based solutions.
Health care is expensive in the U.S., and Washington is no exception. Over two in three respondents (68%) reported experiencing at least one health care affordability burden in the last year; such as being uninsured due to cost, delaying, or forgoing needed health services entirely due to cost or finding themselves in financial burden to their medical care.
A Range of Health Care Affordability Burdens
In Washington, two-thirds (66%) of respondents reported that they, or a family member, skipped or delayed medical care due to cost. Among those reporting affordability challenges, the most common experiences were:
- 30%—Delayed going to the doctor or having a procedure done;
- 25%—Skipped a recommended medical test or treatment;
- 22%—Avoided going to the doctor or having a procedure done altogether;
- 13%—Cut pills in half, skipped doses of medicine or did not fill a prescription;1
- 7%—Skipped or delayed getting a medical assistive device; and
- 3%—Skipped needed maternity or reproductive health care.
While cost was the most commonly cited reason for delaying or foregoing care (24%), factors such as the inability to get an appointment (22%) or the service not being covered by insurance (15%) also contributed to instances of patients delaying or forgoing care. Among uninsured respondents, 45% cited the high cost of insurance as the primary reason they remained without coverage – surpassing other common reasons such as “I don’t need it” and “I don’t know how to get it.” Furthermore (71%) of respondents believe the health care system is unaffordable, and 94% believe health care costs are rising.
Differences in Health Care Affordability Burdens
The frequency and severity of health care affordability burdens may be influenced by an individual’s characteristics, such as their age or income. Survey results from Washington reveal trends in how different populations experience several common affordability burdens, such as affording primary care visits, surgical procedures, and purchasing medical assistive devices.
Income and Employment
Income is one of the most consistent predictors of an individual’s ability to afford health care.[1] Nearly four out of every five respondents (78%) with an annual household income of less than $50,000 reported experiencing at least one health care affordability burden in the last year. These respondents also reported delaying or forgoing care due to cost more frequently than respondents with higher incomes (see Figure 1). Notably, a majority across all income levels reported experiencing health care burdens – including 52% of those with income over $200,000 per year forgoing care.

Employment also plays a critical role in health care affordability—not only by providing income but also by providing access to employer-sponsored insurance, which remains the main source of coverage for non-elderly adults in the U.S..[2] Survey data indicate that part-time workers in Washington may face heightened affordability challenges. Respondents employed part-time reported experience any health care affordability burden more frequently than respondents employed in a full-time position. (see Figure 2).

Insurance Coverage and Type
People with different types of insurance navigate the health care system in different ways. For example, people with private insurance may face higher premiums and out-of-pocket costs, while individuals enrolled in Washington Apple Health, the state Medicaid program, typically encounter lower direct costs but may face other obstacles, including limited provider networks, restrictions on covered services, and longer wait times for appointments.
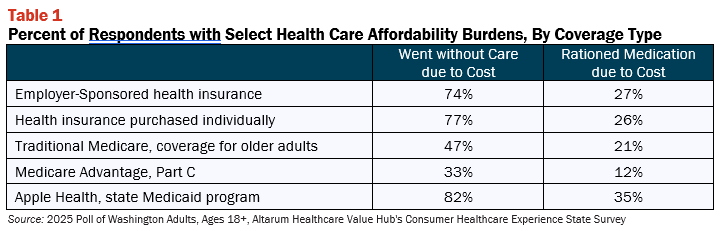
Respondents enrolled in Apple Health reported forgoing care more frequently than respondents with other forms of coverage. Respondents with coverage they purchased on their own, such as through the health insurance Marketplace, reported rationing their medication the most. Respondents enrolled in Medicare, coverage for seniors and people with certain disabilities, reported the lowest incidence of rationing medication or going without care due to cost (see Table 1).
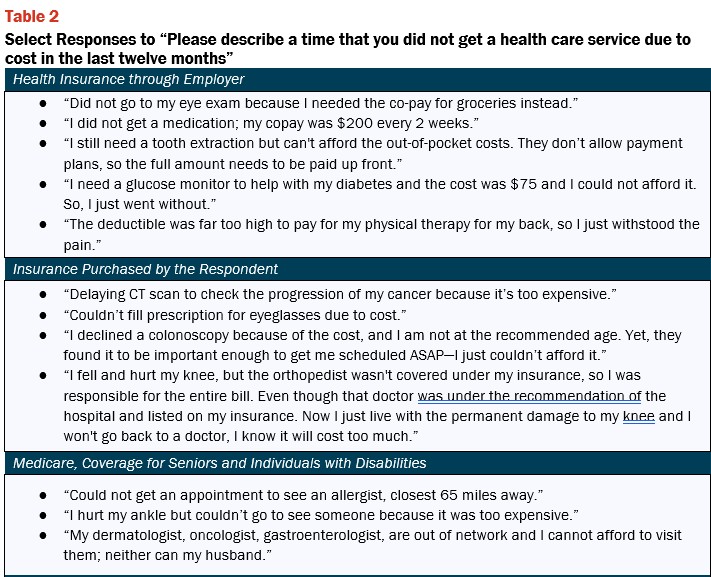
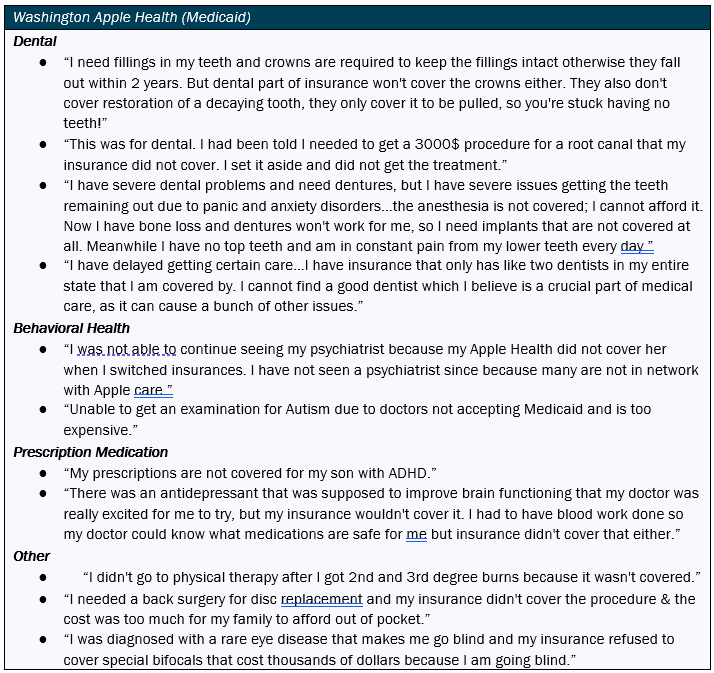
When asked, some survey participants also shared personal accounts of being unable to access necessary health care because of the cost. The anecdotes illuminate a common theme: that challenges finding affordable health care exist across all coverage types. Although individuals without health insurance coverage often face the most acute affordability issues, respondents with commercial insurance, Medicare, and Medicaid also shared narratives revealing difficulties accessing care due to cost (see Table 2). Notably, respondents enrolled in Washington Apple Health described going without care because certain services were not covered or had limited in-network options, including dental care, behavioral health care, and prescription medications. As this was also observed in the previous Washington survey taken in 2022, additional responses were included to capture these details.
Race and Ethnicity
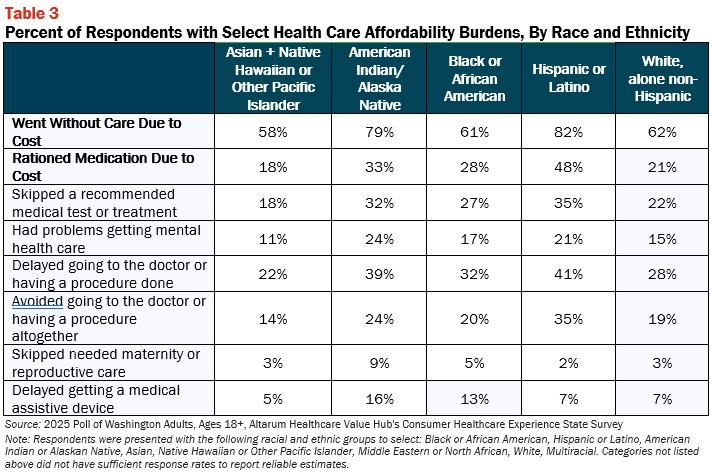
Overall, respondents of color in Washington reported going without care and rationing medication due to cost more frequently than white, alone non-Hispanic respondents. Hispanic/Latino respondents and American Indian/Alaska Native respondents reported the highest rates of going without care and rationing medication due to cost compared to other groups overall (see Table 3). However, Black or African American respondents also frequently reported foregoing specific types of care, including skipping recommended medical tests and delaying getting medical assistive devices.
Age and Disability
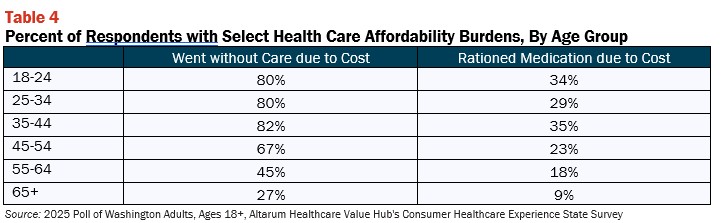
While anyone can be affected by a serious illness or injury, some groups face greater financial obstacles to accessing care. In Washington, young adults aged 18-44 reported similarly high rates of forgoing care due to cost. However, affordability concerns extend across age groups (see Table 4). Most adults over the age of 65 will be insured under Medicare, which provides affordable coverage for basic health services. However, affordability may remain a concern for this group, particularly for older adults with complex or chronic conditions.
Young adults also reported the highest rates of medication rationing due to cost. This finding has important implications for policymakers interested in improving prescription drug affordability in their state. While the survey does not specify which medications were rationed, a non-negligible number of respondents who reported rationing medication due to cost were under the age of 65, highlighting the need for broader efforts to lower out-of-pocket drug costs across all age groups.
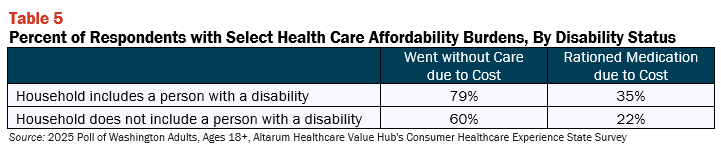
Respondents with a disability, or who live with someone with a disability, also reported higher rates of health care affordability burdens. Of those included in this group, 79% reported going without some form of care and 35% reported rationing medication due to cost in the past year. In contrast, fewer respondents living in a household without a person with a disability reported forgoing care (60%) and rationing medication (22%) due to cost (see Table 5).
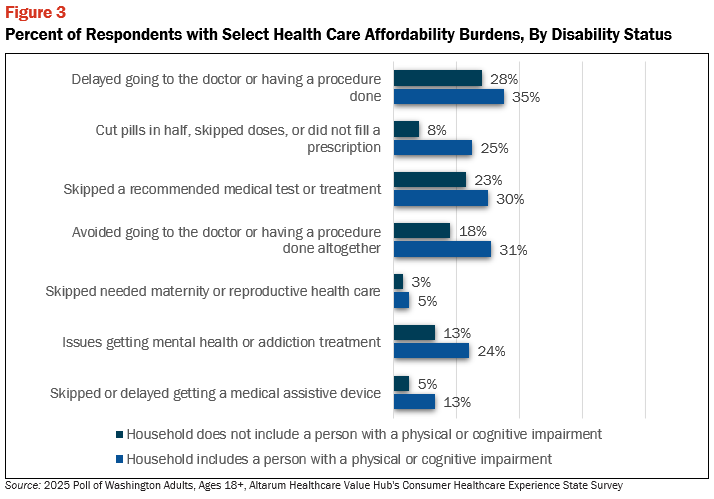
People with disabilities also face affordability burdens specific to their health needs. For example, 13% of respondents with a disability or with a disabled household member reported delaying the purchase of a medical assistive device (like a wheelchair, cane/walker, hearing aid, or prosthetic limb) due to cost, compared to only 5% of respondents in households without a disabled member. Overall, individuals living with or alongside someone with a disability were more likely to experience at least one health care affordability burden (see Figure 3).
Given that 29% of U.S. adults live with some form of disability, more than a quarter of the population often face elevated health care affordability burdens.[3] People with a disability pay an average $13,492 annually for health care, while a person without a disability pays $2,853.[4] Out-of-pocket costs are also more than twice as high for an individual with a disability versus an individual without ($1053 v. $486).[5]
Lastly, respondents living in urban areas reported going without care due to cost more frequently than those living in suburban and rural areas, while respondents that reported living in both urban and rural areas rationed medication at slightly higher rates than those living in suburban areas (see Table 6).

Encountering Medical Debt
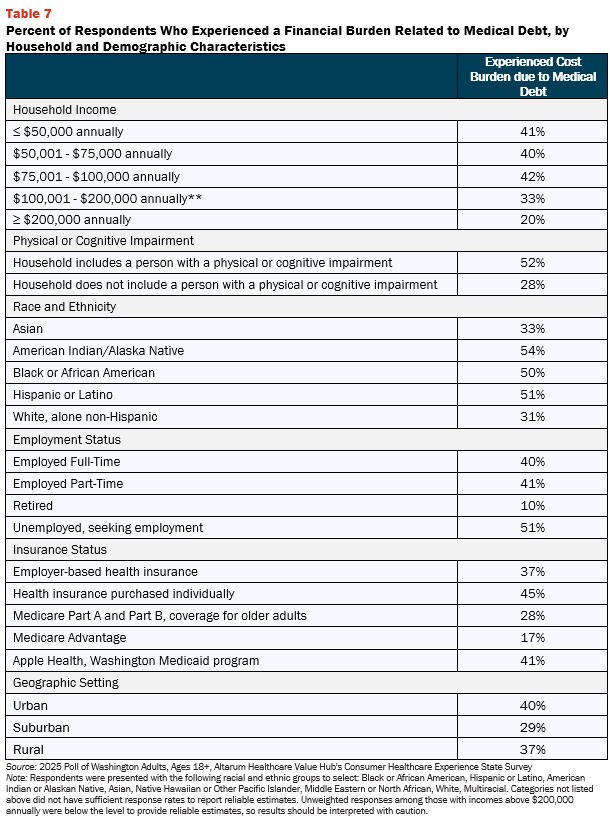
Although many respondents reported delaying, forgoing, or rationing care due to cost, others did receive care but faced financial hardship from the resulting medical bills. More than a third of respondents (35%) reported experiencing at least one significant financial burden related to medical debt, including:
- 16%—Used up all or most of their savings to pay off medical bills;
- 11%—Were contacted by a collection agency;
- 10%—Were unable to pay for basic necessities like food, heat or housing due to medical bills;
- 9%—Borrowed money, took out a loan, or another mortgage on their home to pay off medical bills;
- 8%—Were placed on a long-term payment plan to pay off medical bills;
- 7%—Accumulated large amounts of credit card debt to pay off medical bills;
- 4%—Asked for donations (GoFundMe campaigns) to pay off medical bills; and
- 1%—Declared bankruptcy to pay off medical bills
Respondents of color reported experiencing at least one of the previous financial burdens related to medical debt more frequently than white alone, non-Hispanic/Latino respondents. Likewise, respondents with a disability or who live with a person with a disability also reported navigating medical cost burdens more frequently than respondents without a disabled household member, and respondents with health insurance purchased individually and those with Medicaid coverage reported the highest rates of the above burdens due to medical bills (45%) compared to respondents with all other insurance types (see Table 7).
These findings reflect broader societal challenges. In 2024, nearly 100 million Americans collectively owed more than $220 billion in medical debt.10 Even with insurance, many Americans struggle to afford medical bills—with the average cost of a one-night hospital stay in the Washington State exceeding $4,000, most consumers are unable to afford the cost of a sudden illness or injury.[6],[7] The majority of respondents (78%) reported that they were insured at the time they incurred their medical debt. When asked to describe why they still incurred medical debt despite having health insurance coverage, the most common responses were:
- 45%—My insurance only covered a portion of the service, and the remaining bill is too high;
- 26%—My insurance didn’t cover the service at all;
- 11%—My deductible was too high, and I was not able meet it;
- 4%—My coinsurance was too high, and I could not afford to pay it; and
- 3%—The interest rate on the debt is too high
High Levels of Worry about Affording Care and Coverage
The majority of Washington respondents are concerned about their ability to afford care. In total, 79% of respondents reported being either “worried” or “very worried” about affording some aspect of care in the future. The most commonly cited concerns include:
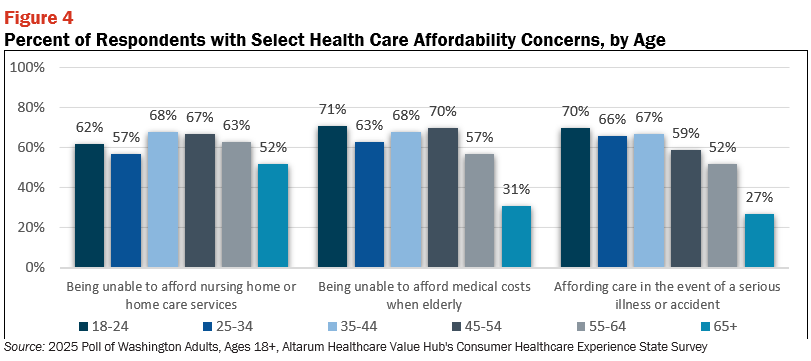
- 62%—Being unable to afford nursing home or home care services;
- 60%—Being unable to afford medical costs when elderly;
- 58%—Affording care in the event of a serious illness or accident;
- 49%—Cost of maternity and reproductive care,
- 48%—Affording prescription drugs; and
- 31%—Cost of needed dental care.
While two of the most frequently cited concerns, affording the cost of nursing home or home care services and affording medical costs when elderly, are typically associated with older adults, these worries were more frequently reported by younger respondents. For example, 52% of respondents aged 18-24 and 49% of those aged 45–54 expressed concern about being able to afford medical costs when they are older. More than half of all respondents under age 65 reported being worried about paying for some form of long-term care (see Figure 4).
The annual cost of long-term care in Washington State ranges from $70,525 for assisted living to over $166,000 for a private room in a nursing facility.[8] Although insurance can offset some of these costs, many plans—including Medicare—only cover long-term care in specific circumstances.[9] As a result, paying out-of-pocket for care may be financially unfeasible for most families, and Medicaid remains the primary payer for nursing home and intermediate care facility services in the absence of a better option.[10],[11]
In addition to age, concerns about affordability were also cited across all other demographic groups. However, certain groups expressed concern more frequently than others, including respondents living in a household that earns less than $50,000 a year, those with a disability or who live with a person with a disability, and those enrolled in Apple Health, Washington’s Medicaid program (see Table 9). Still, over 40% of those earning over $100,000 per year also reported concerns about affording care in the future (see Table 7).
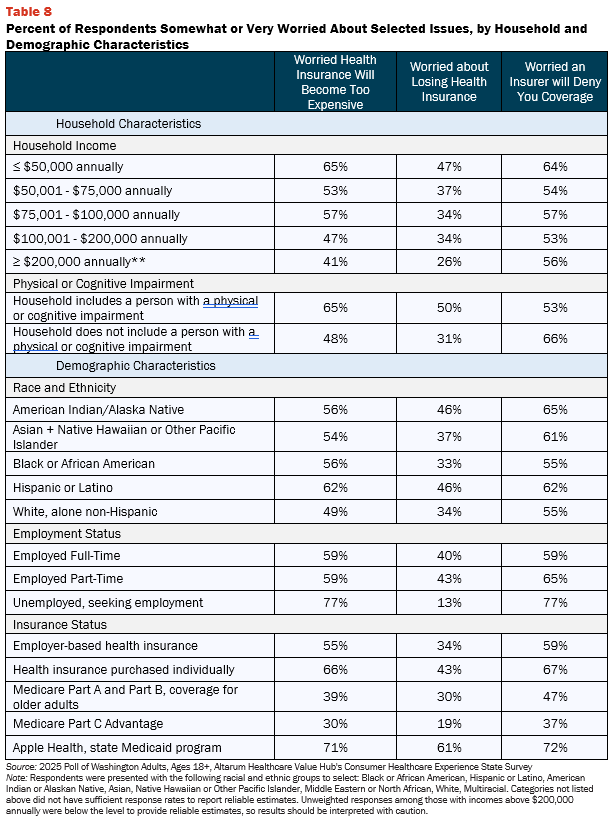
Concerns about paying for specific types of care also were reported, many respondents worried about affording and maintaining health insurance coverage. Overall, 36% of all respondents reported that they were concerned about losing their health insurance coverage, and 53% reported that they were concerned about affording their health insurance coverage. Worry about the cost of insurance was more common than concern about losing coverage, and this pattern held true across all income levels, geographic regions, racial and ethnic groups, and types of coverage (see Table 8).
Finally, 31% of respondents reported that they were aware of a merger or acquisition in their community in the past year. Among those who said they noticed changes following the merger or acquisition, they said:
- 30%— I have to pay more for my care
- 29%—I have fewer choices of providers
- 21%—My doctor is no longer in network
- 16%—I have experienced lower quality care
When asked about their largest concern related to health care consolidation, respondents most frequently reported:
- 27%—I’m concerned I will have to pay more to see my doctor;
- 23%—I’m concerned I will have fewer choices of where to receive care;
- 19%—I’m concerned my doctor may no longer be covered by my insurance;
- 12%—I’m concerned I will have to travel farther to see my doctor; and
- 11%—I’m concerned I will have a lower quality of care.
Respondent Perceptions of the Health System, Policy Solutions
In light of Washington respondents’ health care affordability burdens and concerns, it is not surprising that they are dissatisfied with the health system. Of the respondents surveyed, 82% agreed or strongly agreed that “the system needs to change.”
To investigate further, the survey asked respondents to share their perspectives on governmental actions to address the high health costs.
Government Actions
Washington respondents see government officials as the key stakeholders that need to act to address health system problems. Moreover, addressing health care problems is one of the top priorities that respondents want their elected officials to work on. At the beginning of the survey, respondents were asked what issues the government should address in the upcoming year. Respondents most frequently chose:
- 55% — Health care
- 49% — Economy/joblessness
- 40% — Affordable Housing
When asked about the top three health care priorities the government should address, respondents most frequently chose:
- 51%—Ensure everyone has access to health coverage
- 36%—Ensure the government spends efficiently on public health insurance programs like Medicaid and Medicare while maintaining people’s coverage
- 36% -Improve affordability in the private health insurance market
Washington respondents most frequently reported believing that the responsibility for high health care costs lies with industry stakeholders, such as:
- 72%—Health insurance companies;
- 71%—Drug companies; and
- 44%—Hospitals
- 44%—Medical device manufacturers
At the same time, 43% of respondents saw state government as a possible contributor to rising health care costs.
Support for Policy Solutions
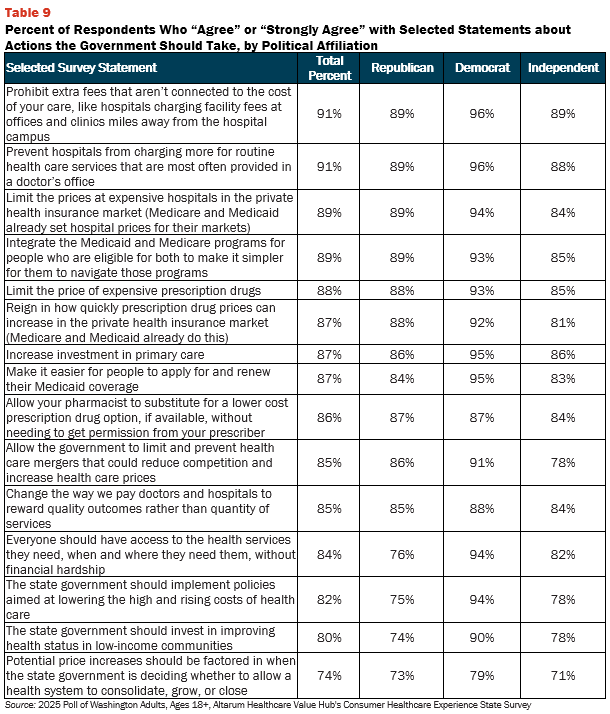
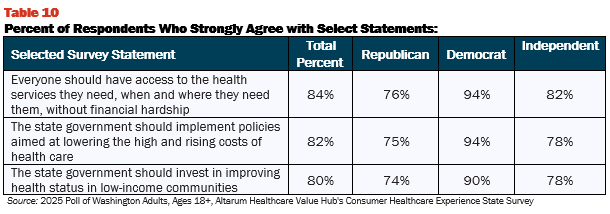
There is strong support for policy change regardless of respondents’ political affiliation (see Table 9). The high burden of health care affordability, along with high levels of support for change, suggest that elected leaders and other stakeholders need to make addressing this consumer burden a top priority. When it comes to tackling costs, respondents endorsed a number of strategies, including:
Notably, respondents across political affiliations also expressed support for ensuring access to affordable care for people regardless of income, as well as the Washington Apple Health Medicaid program.
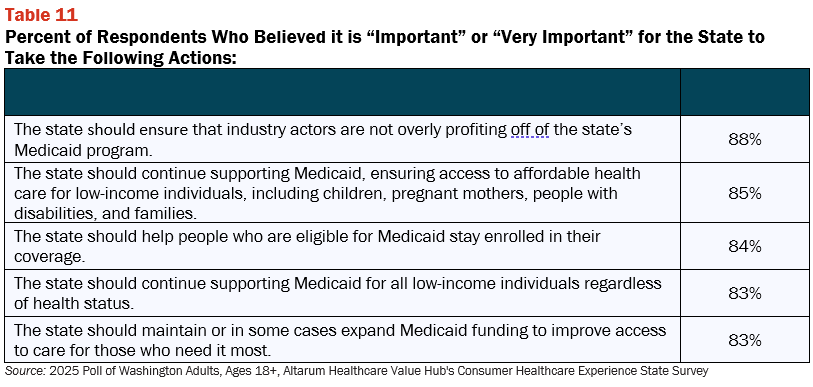
Looking at low-income coverage specifically, survey respondents reported high levels of support for the Medicaid program and the groups it serves. Approximately a fifth of Washington’s population (20%) is covered by Medicaid or the Children’s Health Insurance Program (CHIP), which provides subsidized health insurance to people who are low-income or have a disability,[12] and over 45% of births were covered by Apple Health in 2023.[13] Given its reach, it is not surprising that many respondents expressed support for the program (see Table 2).
Notes
- Tracking Healthcare Affordability and Value. (2024). West Health-Gallup. https://westhealth.org/wp-content/uploads/2024/07/Tracking-Healthcare-Affordability-and-Value_West-Health-Gallup_FINAL-Affordability-Index-2024.pdf
- Health Insurance Coverage of the Total Population. (2024). Kaiser Family Foundation. https://www.kff.org/other/state-indicator/total-population/
- Disability Impacts all of Us [Infographic]. (2024, July 15). Centers for Disease Control and Prevention Disability and Health Branch. https://www.cdc.gov/disability-and-health/media/pdfs/disability-impacts-all-of-us-infographic.pdf
- Kennedy, J., Wood, E.G., Frieden, L. (2017). Disparities in Insurance Coverage, Health Services Use, and Access Following Implementation of the Affordable Care Act: A Comparison of Disabled and Nondisabled Working-Age Adults. INQUIRY 54(1). doi:10.1177/0046958017734031
- Kennedy, J., Wood, E.G., Frieden, L. (2017). Disparities in Insurance Coverage, Health Services Use, and Access Following Implementation of the Affordable Care Act: A Comparison of Disabled and Nondisabled Working-Age Adults. INQUIRY 54(1). doi:10.1177/0046958017734031
- Hospital Expenses per Adjusted Inpatient Day – KFF State Health facts. KFF. (2023). https://www.kff.org/health-costs/state-indicator/expenses-per-inpatient-day/
- Sparks, G., Lopes, L., Montero, A., Presiado, M., & Hamel, L. (2025, July 11). Americans’ Challenges with Health Care Costs. KFF. https://www.kff.org/health-costs/americans-challenges-with-health-care-costs/
- Cost of Care Survey, July through December 2024. (2025). Genworth Financial, Inc. https://pro.genworth.com/riiproweb/productinfo/pdf/282102.pdf
- Medicare. (n.d.) Long-Term Care. Centers for Medicare and Medicaid Services. https://www.medicare.gov/coverage/long-term-care
- Distribution of Certified Nursing Facility Residents by Primary Payer Source. (2024). Kaiser Family Foundation. https://www.kff.org/other/state-indicator/distribution-of-certified-nursing-facilities-by-primary-payer-source
- Medicaid. (n.d.) Intermediate Care Facilities for Individuals with Intellectual Disability. Centers for Medicare and Medicaid Services. https://www.medicaid.gov/medicaid/long-term-services-supports/institutional-long-term-care/intermediate-care-facilities-individuals-intellectual-disability
- Health Insurance Coverage of the Total Population. (2024). Kaiser Family Foundation. https://www.kff.org/other/state-indicator/total-population/
- Washington State Health Care Authority. (n.d.). Medicaid-paid Perinatal Care by County. https://www.hca.wa.gov/assets/program/medicaid-paid-maternity-care-by-county-with-births.pdf
Methodology
Altarum’s Consumer Healthcare Experience State Survey (CHESS) is designed to elicit respondents’ views on a wide range of health system issues, including confidence using the health system, financial burden and possible policy solutions. This survey, conducted from September 9 to October 8, 2025, used a web panel from Dynata with a demographically balanced sample of approximately 1,700 respondents who live in Washington. Information about Dynata’s recruitment and compensation methods can be found here. The survey was conducted in English or Spanish and restricted to adults ages 18 and older. Respondents who finished the survey in less than half the median time were excluded from the final sample, leaving 1,383 cases for analysis. After those exclusions, the demographic composition of respondents was as follows, although not all demographic information has complete response rates:
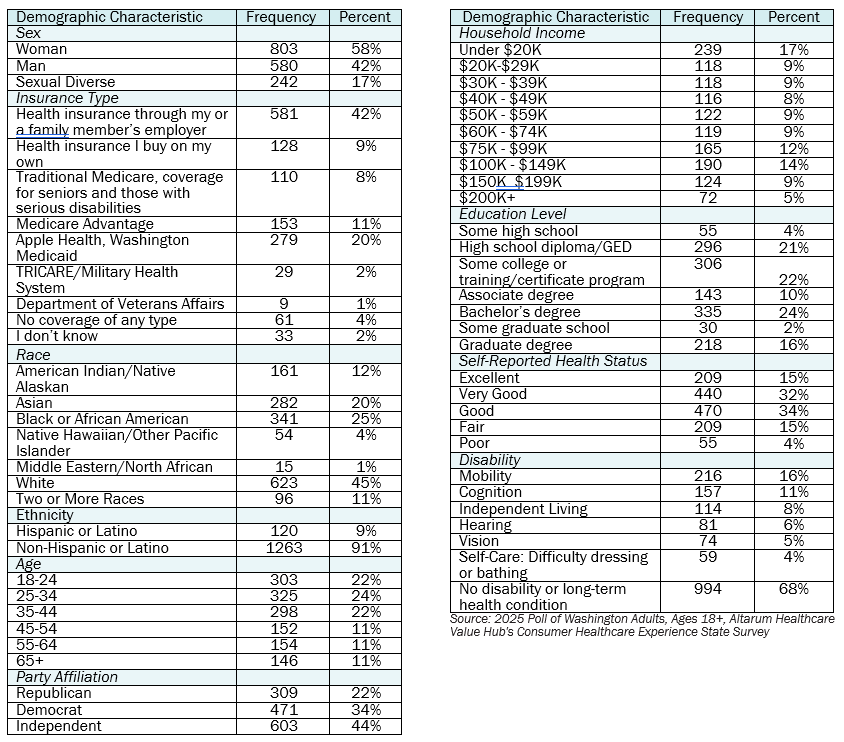
Percentages in the body of the brief are based on weighted values, while the data presented in the demographic table is unweighted. An explanation of weighted versus unweighted variables is available here. Altarum does not conduct statistical calculations on the significance of differences between groups in findings. Therefore, determinations that one group experienced a significantly different affordability burden than another should not be inferred. Rather, comparisons are for conversational purposes. The groups selected for this brief were selected by advocate partners in each state based on organizational/advocacy priorities. We do not report any estimates under N=100 and a co-efficient of variance more than 0.30.
Altarum in Action
Rhode Island Office of the Health Insurance Commissioner cites CHESS survey in letter to State House Committee on Health and Human Services about HB072 related to reimbursement rates and repealing affordability standards. Read more
Washington State Senator Patty Murray’s office cites the WA CHESS survey in press release about Senate Health, Education, Labor and Pensions (HELP) Committee hearing where Senator Murray questioned CEOs of major pharmaceutical companies about the high prices charged to Americans for their prescription drugs. Read more
Read More Altarum in Action Resources