

< View All Healthcare Value Hub Articles
Equity Considerations in Washington Survey on Health Care Affordability Burdens
Related Files

 Washington 2025 Access and Equity Brief
Summary
According to a survey of more than 1,380 Washington adults conducted from September 9 to October 8, 2025, many residents have had inconsistent experiences accessing and affording the health care system in the past year. Among those respondents:
- Over 2 in 3 (68%) experienced at least one health care affordability burden in the past year;
- Nearly 4 in 5 (79%) worry about affording health care in the future;
- 65% are not confident they have enough money to cover the cost of major unexpected illness or injury in their households;
- 56% are not confident they have enough health insurance coverage to cover the cost of a major unexpected illness or injury in their households;
- Respondents living in households that include a person with a physical or cognitive impairment ration medication due to cost more frequently than respondents living in households without a person with a physical or cognitive impairment (35% versus 22%); delay or go without care due to cost more frequently (79% versus 61%); and experience more cost burdens due to medical bills (52% versus 28%);
Variations in Health Care Affordability Between Households
Factors like household income and composition impact how a person navigates the health care system. For example, Washington respondents in households earning less than $50,000 a year reported experiencing a health care affordability burden more frequently than wealthier households (see Table 1). The median household income in Washington in 2023 was $94,605.[1]
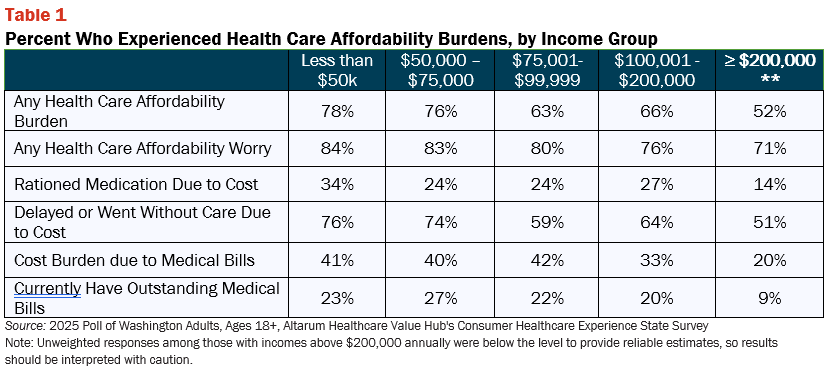
Respondents that earn less than $50,000 annually also more frequently reported experiencing a cost burden due to medical bills, like incurring medical debt, depleting savings, or sacrificing basic needs like food, heat, or housing compared to those earning $100,000 or more annually (41% versus 33%). Still, over half of respondents living in higher income households also faced affordability issues, indicating that these burdens affect all income groups. At least 71% of respondents across all income levels expressed concern about affording health care now or in the future.
Similar to income, household composition can also influence the types of challenges that people are exposed to when navigating the health care system. People with a physical or cognitive impairment, for instance, interact with the health care system more often than others, which frequently results in greater out-of-pocket costs.[2] Washington respondents with a physical or cognitive impairment, or who live with a person with a physical or cognitive impairment, reported experiencing an affordability burden or concern more frequently than other respondents (see Table 2).

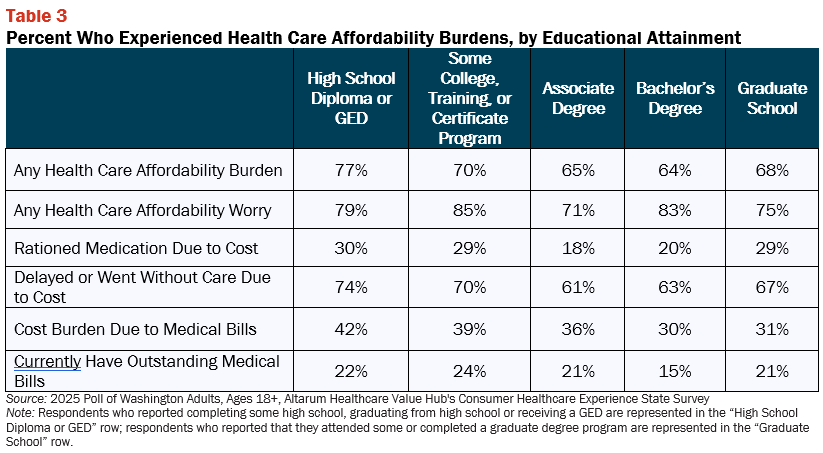
Variations in Health Care Affordability Between Demographic Groups Research has shown that demographic differences persist in self-reported health status, access and affordability.[3] This survey also revealed variations in reported affordability burdens between demographic groups. Starting with education, Washington respondents with a Bachelor’s or graduate degree reported experiencing a health care affordability burden less frequently than respondents with lower educational attainment. In contrast, respondents without a formal education beyond a high school diploma or GED reported experiencing a health care affordability burden (66%), and a health care cost burden due to medical bills (44%) more frequently than other respondents (see Table 3).
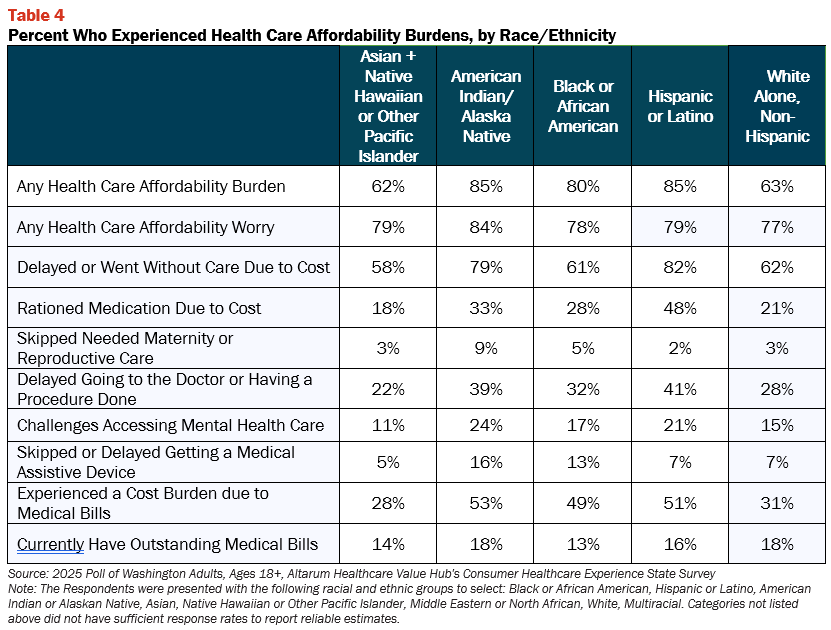
Likewise, certain respondents of color reported higher rates of multiple affordability burdens compared to white alone, non-Hispanic respondents. American Indian/Alaska Native and Hispanic or Latino respondents generally reported the highest rates of going without care and incurring financial burdens due to medical bills, followed by Black or African American respondents (see Table 4).
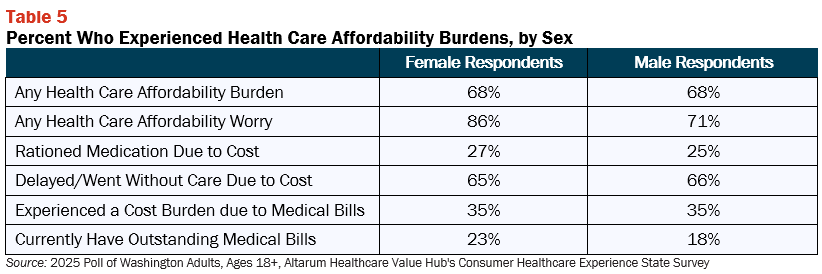
Differences in the frequency of reported health care affordability burdens and concerns by sex also emerged in the survey results. Women and men reported similar rates of going without care due to cost and rationing medication, although women reported higher rates of outstanding medical bills (23% versus 18%) (see Table 5). Although many respondents expressed concerns about health care costs, a higher percentage of female respondents reported being worried about affording some aspect of coverage or care compared to male respondents (86% versus 71%).
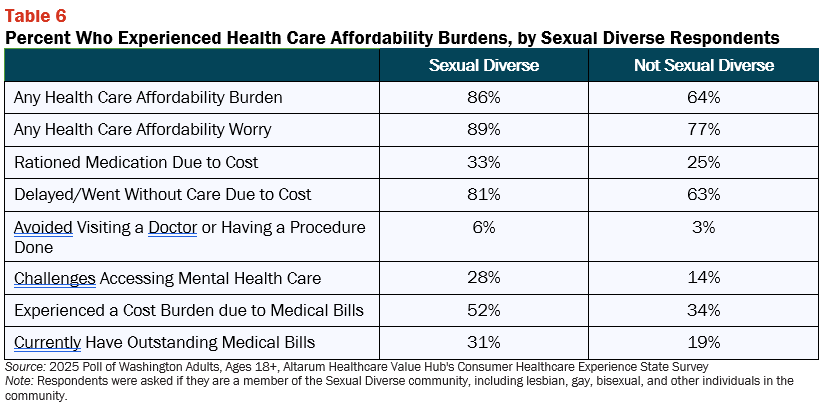
Respondents that identify as sexually diverse also experienced affordability burdens, with 33% reporting rationing medication due to cost compared to 25% of respondents that are not a part of a sexual minority group (see Table 6). Members of these communities experience higher rates of disability and encounter unique challenges accessing health care and medications.[4],[5],[6]
Most (82% of) Washington respondents agreed or strongly agreed that the U.S. health care system needs to change. Interestingly, there is bipartisan support for government-led solutions for more information on the types of strategies Washington residents support, see: Washington Residents Struggle to Afford High Health Care Costs; Worry about Affording Health Care in the Future; Support Government Action across Party Lines, Healthcare Value Hub, Data Brief (November 2025).
Notes
- U.S. Census Bureau, U.S. Department of Commerce. (2023). Washington Income in the Past 12 Months (in 2023 Inflation-Adjusted Dollars). American Community Survey, ACS 1-Year Estimates Subject Tables, Table S1901. Retrieved December 16, 2025, from https://data.census.gov/table/ACSST1Y2023.S1901?g=040XX00US53
- Miles, Angel L., Challenges and Opportunities in Quality Affordable Health Care Coverage for People with Disabilities, Protect Our Care Illinois (February 2021), https://protectourcareil.org/index.php/2021/02/26/challenges-and-opportunities-in-quality-affordable-health-care-coverage-for-people-with-disabilities/
- Mahajan, S., Caraballo, C., Lu, Y., et al. (2021). Trends in differences in health status and health care access and affordability by race and ethnicity in the United States, 1999-2018, JAMA, 326(7), 637-648. Trends in Differences in Health Status and Health Care Access and Affordability by Race and Ethnicity in the United States, 1999-2018 | Health Disparities | JAMA | JAMA Network
- Alex Montero, Liz Hamel, Samantha Artiga, & Lindsey Dawson. (2024). LGBT Adults’ Experiences with Discrimination and Health Care Disparities: Findings from the KFF Survey of Racism, Discrimination, and Health. KFF. https://www.kff.org/racial-equity-and-health-policy/poll-finding/lgbt-adults-experiences-with-discrimination-and-health-care-disparities-findings-from-the-kff-survey-of-racism-discrimination-and-health/
- Bosworth, Arielle, et al., Health Insurance Coverage and Access to Care for LGBTQ+ Individuals: Current Trends and Key Challenges, ASPE Office of Health Policy (July 2021), https://www.aspe.hhs.gov/sites/default/files/2021-07/lgbt-health-ib.pdf
- Casanova-Perez R, Apodaca C, Bascom E, et al, “Broken down by bias: Healthcare biases experienced by BIPOC and LGBTQ+ patients,” AMIA Annu Symp Proc. 2022;2021:275-284, Published 2022 Feb 21.
Methodology
Altarum’s Consumer Healthcare Experience State Survey (CHESS) is designed to elicit respondents’ views on a wide range of health system issues, including confidence using the health system, financial burden and possible policy solutions. This survey, conducted from September 9 to October 8, 2025, used a web panel from Dynata with a demographically balanced sample of approximately 1,700 respondents who live in Washington. Information about Dynata’s recruitment and compensation methods can be found here. The survey was conducted in English or Spanish and restricted to adults ages 18 and older. Respondents who finished the survey in less than half the median time were excluded from the final sample, leaving 1,383 cases for analysis. After those exclusions, the demographic composition of respondents was as follows, although not all demographic information has complete response rates:
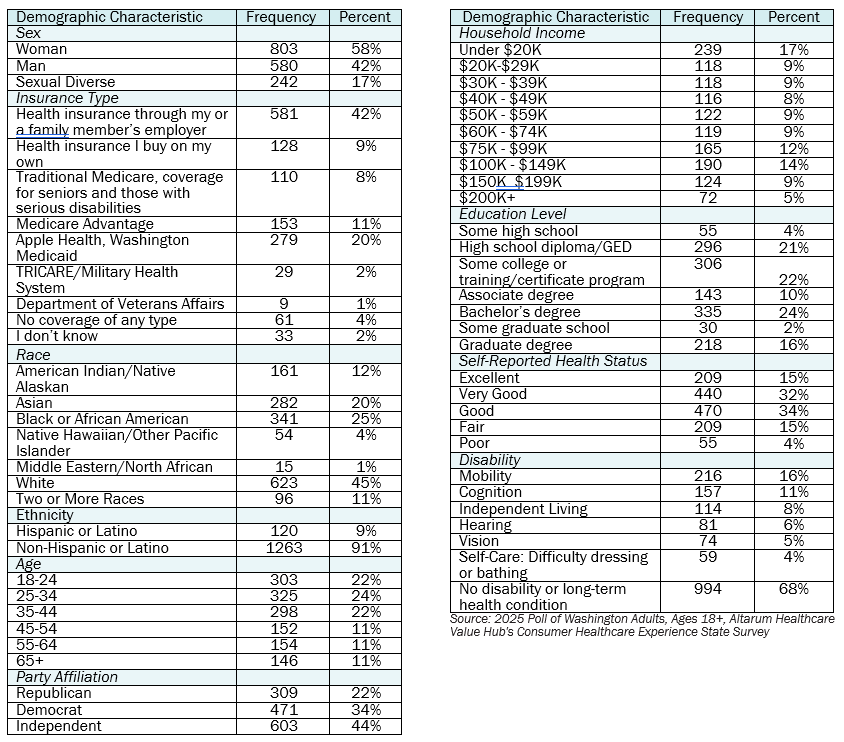
Percentages in the body of the brief are based on weighted values, while the data presented in the demographic table is unweighted. An explanation of weighted versus unweighted variables is available here. Altarum does not conduct statistical calculations on the significance of differences between groups in findings. Therefore, determinations that one group experienced a significantly different affordability burden than another should not be inferred. Rather, comparisons are for conversational purposes. The groups selected for this brief were selected by advocate partners in each state based on organizational/advocacy priorities. We do not report any estimates under N=100 and a co-efficient of variance more than 0.30.
Altarum in Action
Rhode Island Office of the Health Insurance Commissioner cites CHESS survey in letter to State House Committee on Health and Human Services about HB072 related to reimbursement rates and repealing affordability standards. Read more
Washington State Senator Patty Murray’s office cites the WA CHESS survey in press release about Senate Health, Education, Labor and Pensions (HELP) Committee hearing where Senator Murray questioned CEOs of major pharmaceutical companies about the high prices charged to Americans for their prescription drugs. Read more
Read More Altarum in Action Resources