

< View All Healthcare Value Hub Articles
Washington Survey Respondents Receive Unexpected Medical Bills and Incur Medical Debt; Express Bipartisan Support for Government Action
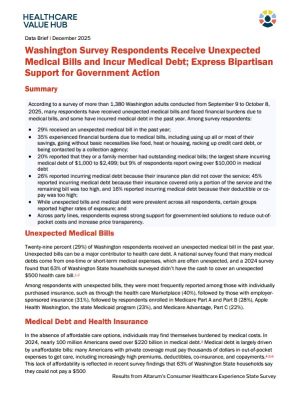
 Washington 2025 Medical Debt and Surprise Medical Bill Brief
According to a survey of more than 1,380 Washington adults conducted from September 9 to October 8, 2025, many respondents have received unexpected medical bills and faced financial burdens due to medical bills, and some have incurred medical debt in the past year. Among survey respondents:
- 29% received an unexpected medical bill in the past year;
- 35% experienced financial burdens due to medical bills, including using up all or most of their savings, going without basic necessities like food, heat or housing, racking up credit card debt, or being contacted by a collection agency;
- 20% reported that they or a family member had outstanding medical bills; the largest share incurring medical debt of $1,000 to $2,499; but 9% of respondents report owing over $10,000 in medical debt
- 26% reported incurring medical debt because their insurance plan did not cover the service; 45% reported incurring medical debt because their insurance covered only a portion of the service and the remaining bill was too high, and 16% reported incurring medical debt because their deductible or co-pay was too high;
- While unexpected bills and medical debt were prevalent across all respondents, certain groups reported higher rates of exposure; and
- Across party lines, respondents express strong support for government-led solutions to reduce out-of-pocket costs and increase price transparency.
Unexpected Medical Bills
Twenty-nine percent (29%) of Washington respondents received an unexpected medical bill in the past year. Unexpected bills can be a major contributor to health care debt. A national survey found that many medical debts come from one-time or short-term medical expenses, which are often unexpected, and a 2024 survey found that 63% of Washington State households surveyed didn’t have the cash to cover an unexpected $500 health care bill.[1],[2]
Among respondents with unexpected bills, they were most frequently reported among those with individually purchased insurance, such as through the health care Marketplace (40%), followed by those with employer-sponsored insurance (31%), followed by respondents enrolled in Medicare Part A and Part B (28%), Apple Health Washington, the state Medicaid program (23%), and Medicare Advantage, Part C (22%).
Medical Debt and Health Insurance
In the absence of affordable care options, individuals may find themselves burdened by medical costs. In 2024, nearly 100 million Americans owed over $220 billion in medical debt.[3] Medical debt is largely driven by unaffordable bills: many Americans with private coverage must pay thousands of dollars in out-of-pocket expenses to get care, including increasingly high premiums, deductibles, co-insurance, and copayments.[4],[5],[6] This lack of affordability is reflected in recent survey findings that 63% of Washington State households say they could not pay a $500 unexpected medical bill, and would either have to incur debt to pay it or would not be able to pay the bill at all.[7] These factors contribute to the rising amount of medical debt that many Washingtonians face, which negatively impacts long-term financial security and ability to afford care in the future.
Medical debt is an issue for survey respondents as well: 20% of respondents reported that they or a family member had outstanding medical bills.
Among those with outstanding medical bills, the most common amount of medical debt reported was $1,000-$2,499, reported by 23% of respondents. The next most frequently cited amounts were $500 – $999 (20%) and less than $500 (19%). Ten percent of respondents reported medical debt of $2,500 – $4,999 and $5,000 – $7,499. Nearly 1 in 10 respondents (9%) report owing over $10,000 in medical debt. The duration of medical debts varied, with the largest share having a medical debt in their family for less than a year (42%) followed by 1-2 years (34%) and 3-5 years (13%).
Medical debt affects both insured and uninsured people (see Table 1). Medical debt can be common among uninsured people in part because they are responsible for the full cost of care.[8],[9] Those with employer-sponsored, individual, and marketplace insurance may also be exposed to medical debt through high cost-sharing.[10] While Medicaid and Medicare enrollees often have low or no cost-sharing, they may have fewer covered services or a lack of providers who will accept their insurance, requiring them to pay out-of-pocket.[11],[12] All of these factors can contribute to medical debt across insurance types.
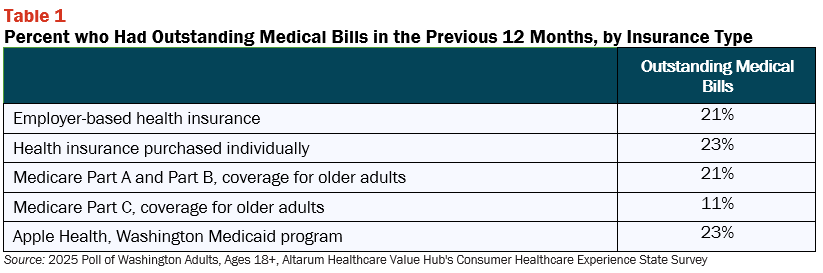
More than three-quarters (78%) of those with medical debt had health insurance at the time they incurred the debt. At the time of the survey, almost half (46%) reported being covered by employer-sponsored insurance, followed by Medicare Part C (14%), insurance bought on the Marketplace exchange (11%), and Apple Health (12%), and Medicare Part A and B (9%). Most respondents (83%) had no gaps in coverage in the past 12 months.
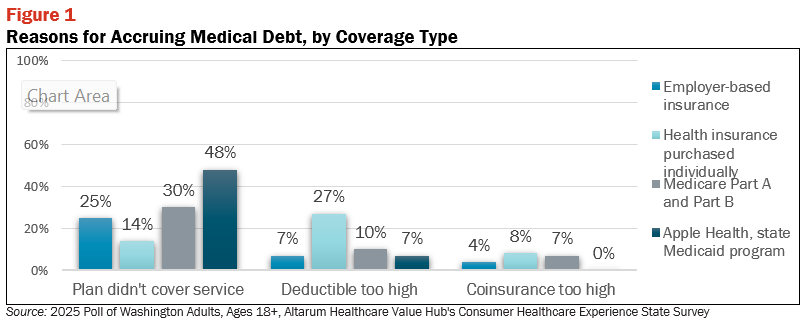
When asked why they incurred medical debt, 26% reported that their insurance did not cover the service at all. while almost half (45%) reported that they incurred debt because their insurance only covered a portion of the service and the remaining bill was too high, alongside 11% because their deductible was too high and they were unable to meet it and 4% because their coinsurance was too high. Notably, larger shares of those with Apple Health and Medicare reported that it was because their insurance plan did not cover the service compared to other coverage types; in contrast, those with employer-sponsored or individually purchased insurance reported higher rates of incurring medical debt because their deductible was too high (see Figure 1).
Differences in Amount and Sources of Medical Debt
Respondents most frequently identified the following services as the source of their medical debt:
- 62%—Hospital
- 31%—Laboratory (lab tests, x-rays, scans)
- 29%—Doctor or technician in hospital
- 22%—Urgent care centers
- 19%—Doctor or technician not in hospital
These findings of medical debt attributed to hospitals persist despite state laws that require Washington hospitals to inform patients of the availability of financial assistance and charity care and eligibility for discounted care between 300% – 400% of the federal poverty level.[13] People also reported physical therapist or pain management clinic (15%), dental provider (13%) mental healthcare or addiction treatment (12%), pregnancy-related expenses (6%), as care that generated their medical debt.
Across all respondents, the majority had outstanding medical bills totaling less than $3,000 (19% had less than $500 in outstanding medical bills, 20% had $500-999 in outstanding medical bills, and 23% had $1,00-$2,499 in medical bills). Still, the remaining respondents had outstanding medical bills ranging from $2,500 to $10,000 or more. Medical debt affects consumers across incomes, age groups, and other demographic characteristics; however, there are differences in the prevalence of medical debt across groups (see Table 6), as well as the amounts and reasons for incurring medical debt.
Income
Those earning $50,001 to $75,000 reported the highest rates of medical debt, followed by those earning less than $50,000 (see Table 6). While over two-thirds (68%) of respondents with household incomes of less than $50,000 per year report having $2,500 in medical debt or less, six percent (6%) owe more than $10,000 in medical debt (see Figure 2). Interestingly, a higher proportion of respondents with household incomes above $100,000 per year report owing more than $10,000 in debt (10%) than respondents in any other income bracket.


Medical debt affects people across the income spectrum. While medical debt is most prevalent among low- and middle-income households, even high-income households are exposed to medical debt for similar reasons, including being unable to afford medical bills and expecting insurance to pay for services.[14]
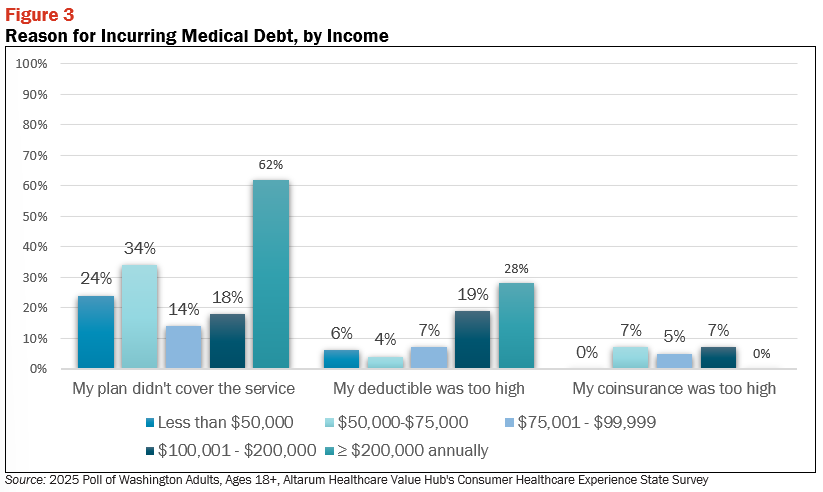
There are some differences across income brackets related to why respondents accrued medical debt. Those earning less than $50,000 reported the second highest rates of accruing medical debt because their plan did not cover the service (24%). However, similar percentages of respondents from all other income brackets reported the same reason (see Figure 3).
Those earning over $100,000 reported the highest rates of accruing debt because their deductible was too high (40%), although similar percentages of those earning between $50,000 – $75,000 (35%) and between $75,001 – $99,999 (36%) reported the same. Still, almost a quarter (22%) of those earning below $50,000 reported their deductible being too high was a cause of their medical debt. High coinsurance also seemed to be a common reason for medical debt accrual across all income levels, though slightly less so for those earning $100,000 or more.
Age
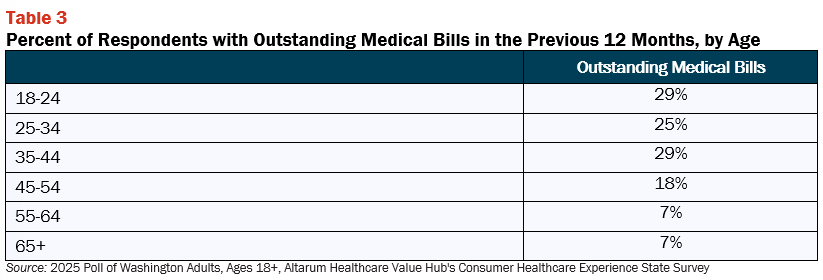
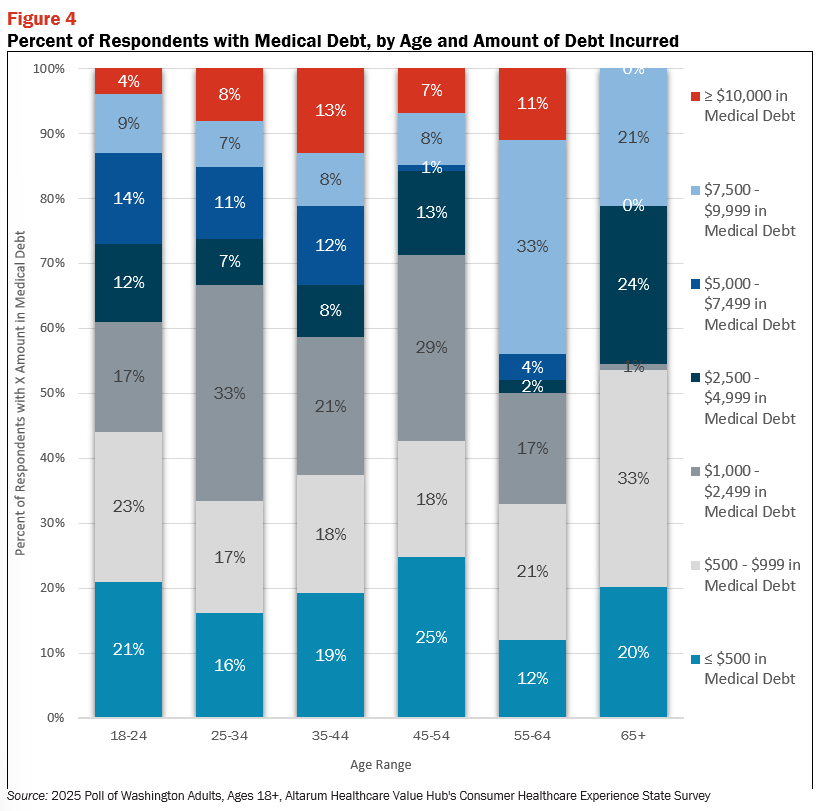
Respondents of different ages reported different incidences of medical debt. Those ages 18-24 and 35-44 reported the highest rates of medical debt, followed by those ages 25-34 (see Table 3). Thirty-three percent of respondents ages 25-34, 55-64, and 65+ reported owing $1000-$2499, $7500-$9999, and $500-$999, respectively, in medical debt. Respondents ages 35-44 reported having more than $10,000 in medical debt, the most frequently among age groups (13%) (see Figure 4).
Nationally, rates of medical debt are higher among middle age and young adults, who are more frequently exposed to the combined high cost of care for themselves, children, spouses, and aging relatives.[15] Studies have also found that large shares of non-elderly households cannot afford to pay typical cost-sharing amounts, especially those with low incomes.[16] Medical debt impacts long-term financial security, with many adults delaying buying homes and education.[17]
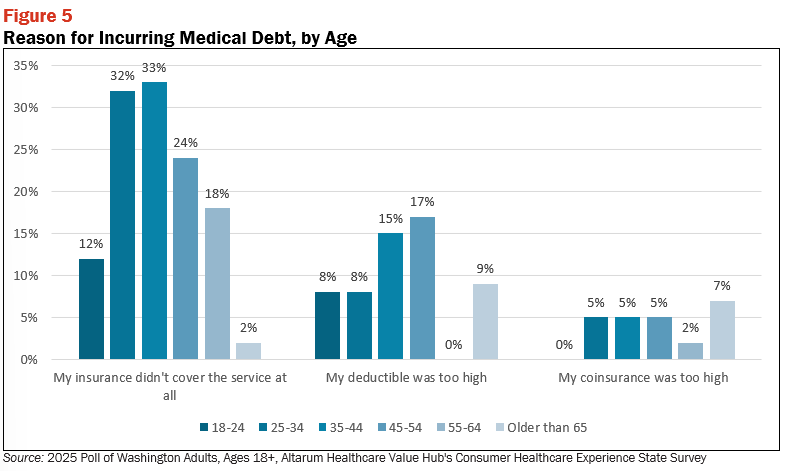
Although the prevalence of health care debt can decline with age, one in five adults ages 65 and older still have medical debt nationwide, with roughly one-third taking money out of retirement, college, or other long-term savings accounts.[18] In addition, adults of all ages have reported medical debt negatively impacting their credit scores.[19] These conditions can make it more difficult for adults of all ages to afford needed care in the future. Across age groups, respondents report [similar/different] reasons for accruing medical debt. Roughly one third of respondents ages 25-34 (32%) and 35-44 (33%) report accruing medical debt because their insurance plan didn’t cover the service(s) they received (see Figure 5). While respondents age 45-54 reported higher rates of accruing medical debt because their deductible was too high (17%) compared to other age groups, respondents older than 65 higher rates of accruing medical debt because their coinsurance was too high (7%).
Disability
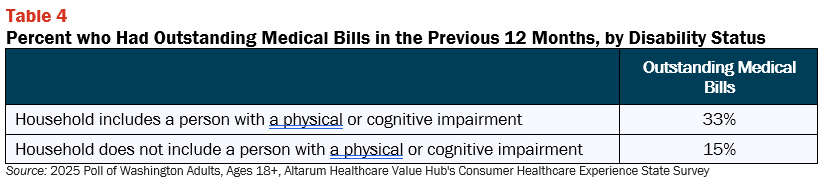
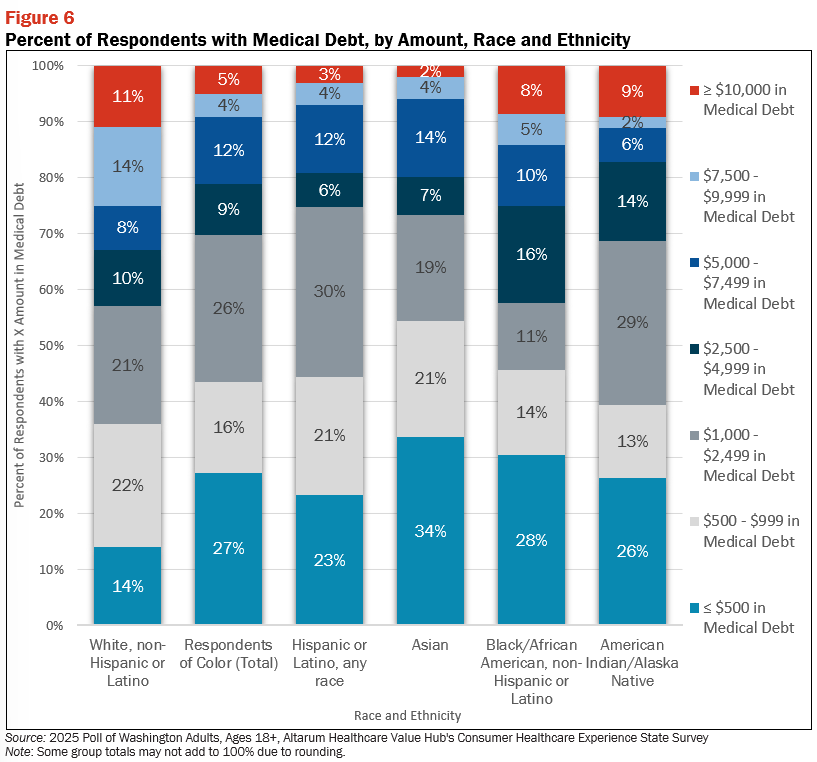
Some of the highest rates of medical debt were seen among households that include a person with a disability. Respondents whose households included a member with a disability reported higher rates of medical debt for themselves or their family 33%) compared to those without a household member with a disability. (15%) (see Table 4). Respondents with a household member with a disability most frequently reported owing less than $500 in medical debt (23%), while those without a household member with disabilities most frequently reported medical debt of $1000- $2499 (28%) (see Figure 6).

While medical debt occurs across demographic groups, people with disabilities and health issues often report higher rates of medical debt.[20] People with complex health needs require ongoing care and can incur high out-of-pocket costs as a result.[21]They may also experience unemployment and income loss, further impacting their ability to afford medical bills.[22]
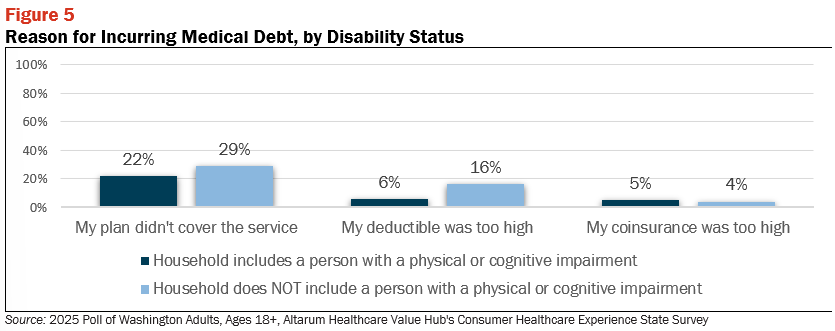
Respondents with a disabled household member reported similar reasons for accruing medical debt. Twenty-two percent of respondents with a disabled household member reported that they accrued medical debt because their plan didn’t cover the service (22%) compared to 29% percent of those without a disabled household member. Similarly, 6% of those with a household member with a disability had medical debt because their deductible was too high, a higher rates than households without a member with a disability (see Figure 5).
Race and Ethnicity
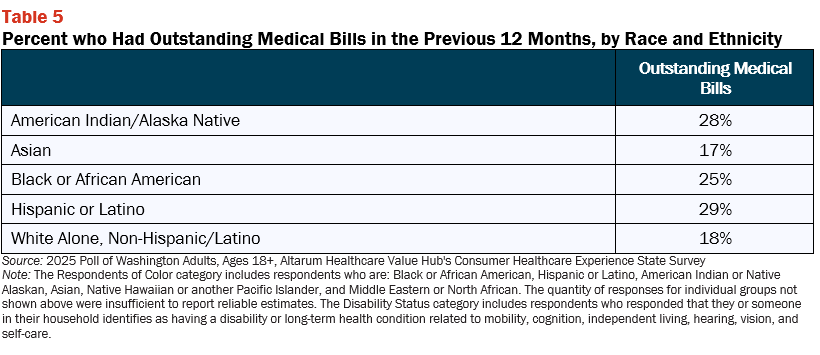
Differences in medical debt exposure were also seen across racial/ethnic groups. Respondents of color reported higher rates of medical debt (25%) compared to White alone non-Hispanic respondents (18%) (see Table 5) Hispanic/Latino respondents most commonly report owing less than $2,500 in medical debt (75%), followed by Black/African American respondents (76%) and white alone non-Hispanic respondents (57%). White alone non-Hispanic respondents most commonly report having $7,500 or more in medical debt (at 17%), compared to Hispanic/Latino respondents (9%) and Black/African American (11%) respondents (see Figure 6).
Conclusion
Washington respondents report receiving unexpected medical bills that are often higher than anticipated. While some disputed their bills, many ended up paying them in full. In some cases, respondents experienced financial burdens to pay their medical bills, such as using up all their savings and going without other necessities. In other cases, respondents were unable to pay and had outstanding bills resulting in medical debt, or experienced other financial burdens due to medical bills such as credit card debt, loans, and bills going to collections. Respondents largely incurred medical debt due to unaffordable out-of-pocket costs. The majority had health insurance, and most reported incurring medical debt because their insurance plan did not cover the service, or because their deductible or co-insurance was too high and they could not afford to pay it.
Respondents across the political spectrum expressed support for policies to increase health care price transparency and curb excess prices that could lead to high out-of-pocket costs (for more information on respondents support for policy interventions, see Washington Survey Respondents Struggle to Afford High Health Care Costs; Worry about Affording Health Care in the Future; Express Bipartisan Support for Policy Solutions). While some system level changes can reduce prices and make them more transparent to consumers, if the resulting costs remain unaffordable for consumers, medical debt will continue to be an issue. Given the financial impacts of high medical bills and medical debt, state policymakers can use these insights to investigate policies that protect consumers from unaffordable out-of-pocket costs and prevent medical debt before it occurs.
Notes
- Lopes, L., Kearney, A., Montero, A., Hamel, L., & Brodie, M. (2022, June 16). Health Care Debt in the U.S.: The broad consequences of medical and dental bills – main findings – 9957. KFF.
- Fair Health Prices WA. (n.d.-a). 2024 Washington State Health Care Affordability Survey. https://fairhealthprices.org/wp-content/uploads/2024/08/Report-2024-WA-Health-Care-Affordability-Survey.pdf
- Bell, C. (2024, October 1). CFPB Takes Action to Protect Consumers from Illegal Medical Debt Collection Practices. CR Advocacy. https://advocacy.consumerreports.org/press_release/cfpb-takes-action-to-protect-consumers-from-illegal-medical-debt-collection-practices/
- Median Medical Out-of-Pocket Spending, SHADAC analysis of Medical Expenditure Panel Survey – Insurance Component (MEPS-IC), Agency for Healthcare Research and Quality (AHRQ), Center for Financing, Access and Cost Trends (CFACT), State Health Compare, SHADAC, University of Minnesota, statehealthcompare.shadac.org, Accessed May 13, 2025.
- Average annual employer sponsored insurance premium, SHADAC analysis of Medical Expenditure Panel Survey – Insurance Component (MEPS-IC), Agency for Healthcare Research and Quality (AHRQ), Center for Financing, Access and Cost Trends (CFACT), State Health Compare, SHADAC, University of Minnesota, statehealthcompare.shadac.org, Accessed May 13, 2025.
- Average annual employer sponsored insurance deductible, SHADAC analysis of Medical Expenditure Panel Survey – Insurance Component (MEPS-IC), Agency for Healthcare Research and Quality (AHRQ), Center for Financing, Access and Cost Trends (CFACT), State Health Compare, SHADAC, University of Minnesota, statehealthcompare.shadac.org, Accessed [DATE].
- Fair Health Prices WA. (2024, August). 2024 Washington State Health Care Affordability Survey. https://fairhealthprices.org/wp-content/uploads/2024/08/Report-2024-WA-Health-Care-Affordability-Survey.pdf
- Health Care Debt in the U.S., KFF, 2022.
- Rakshit, S., Rae, M., Claxton, G., Amin, K., & Cox, C. (2024, February 12). The Burden of Medical Debt in the United States. Peterson-KFF Health System Tracker. https://www.healthsystemtracker.org/brief/the-burden-of-medical-debt-in-the-united-states/#Share%20of%20adults%20who%20have%20medical%20debt,%20by%20demographics,%202021
- Young, G., Rae, M., Claxton, G., Wager, E., & Amin, K. (2022, March 10). How Many People Have Enough Money to Afford Private Insurance Cost Sharing?. Peterson-KFF Health System Tracker. https://www.healthsystemtracker.org/brief/many-households-do-not-have-enough-money-to-pay-cost-sharing-in-typical-private-health-plans/#Median%20liquid%20assets%20of%20households%20and%20maximum%20out-of-pocket%20limit%20allowed%20in%20private%20plans%20for%20in-network%20services,%20by%20household%20size,%202019
- Elani HW, Sommers BD. Fillings Needed for Gaps in Government Dental Coverage. JAMA Health Forum. 2025;6(2):e250370. doi:10.1001/jamahealthforum.2025.0370
- Ludomirsky, A. B., Schpero, W. L., Wallace, J., Lollo, A., Bernheim, S., Ross, J. S., & Ndumele, C. D. (2022). In Medicaid Managed Care Networks, Care Is Highly Concentrated Among A Small Percentage Of Physicians. Health Affairs, 41(5), 760–768. https://doi.org/10.1377/hlthaff.2021.01747
- https://www.fairhealthpriceswa.org/wp-content/uploads/2024/08/Report-2024-WA-Health-Care-Affordability-Survey.pdf
- Health Care Debt in the U.S., KFF, 2022.
- Cottrill, A., Neuman, T., Lopez, L., & Hamel, L. (2024, July 26). What are the consequences of health care debt among older adults?. KFF. https://www.kff.org/medicare/issue-brief/what-are-the-consequences-of-health-care-debt-among-older-adults/
- How Many People Have Enough Money to Afford Private Insurance Cost Sharing?. Peterson-KFF Health System Tracker, 2022.
- Levey, N. N. (2022, January 16). 100 Million People in America Are Saddled With Health Care Debt. KFF Health News. https://kffhealthnews.org/news/article/diagnosis-debt-investigation-100-million-americans-hidden-medical-debt/
- What are the consequences of health care debt among older adults?, KFF, 2024.
- Health Care Debt in the U.S., KFF, 2022.
- The Burden of Medical Debt in the United States, Peterson-KFF Health System Tracker, 2024.
- Park S, Stimpson JP. Health Care Expenses and Financial Hardship Among Medicare Beneficiaries With Functional Disability. JAMA Netw Open. 2024;7(6):e2417300. doi:10.1001/jamanetworkopen.2024.17300 [1] Goodman, N., Morris, M., & Boston, K. (2017). Financial Inequality: Disability, Race and Poverty in America. National Disability Institute. https://www.nationaldisabilityinstitute.org/wp-content/uploads/2019/02/disability-race-poverty-in-america.pdf
Methodology
Altarum’s Consumer Healthcare Experience State Survey (CHESS) is designed to elicit respondents’ views on a wide range of health system issues, including confidence using the health system, financial burden and possible policy solutions. This survey, conducted from September 9 to October 8, 2025, used a web panel from Dynata with a demographically balanced sample of approximately 1,700 respondents who live in Washington. Information about Dynata’s recruitment and compensation methods can be found here. The survey was conducted in English or Spanish and restricted to adults ages 18 and older. Respondents who finished the survey in less than half the median time were excluded from the final sample, leaving 1,383 cases for analysis. After those exclusions, the demographic composition of respondents was as follows, although not all demographic information has complete response rates:
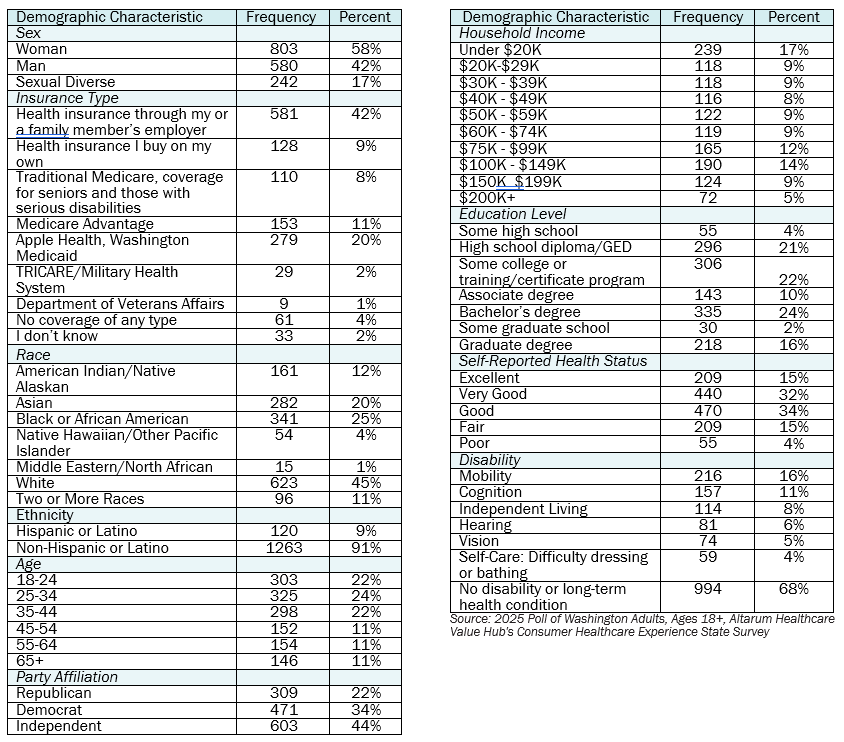
Percentages in the body of the brief are based on weighted values, while the data presented in the demographic table is unweighted. An explanation of weighted versus unweighted variables is available here. Altarum does not conduct statistical calculations on the significance of differences between groups in findings. Therefore, determinations that one group experienced a significantly different affordability burden than another should not be inferred. Rather, comparisons are for conversational purposes. The groups selected for this brief were selected by advocate partners in each state based on organizational/advocacy priorities. We do not report any estimates under N=100 and a co-efficient of variance more than 0.30.
Altarum in Action
Rhode Island Office of the Health Insurance Commissioner cites CHESS survey in letter to State House Committee on Health and Human Services about HB072 related to reimbursement rates and repealing affordability standards. Read more
Washington State Senator Patty Murray’s office cites the WA CHESS survey in press release about Senate Health, Education, Labor and Pensions (HELP) Committee hearing where Senator Murray questioned CEOs of major pharmaceutical companies about the high prices charged to Americans for their prescription drugs. Read more
Read More Altarum in Action Resources