

< View All Healthcare Value Hub Articles
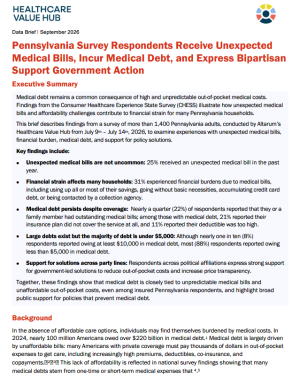
Pennsylvania Survey Respondents Receive Unexpected Medical Bills, Incur Medical Debt, and Express Bipartisan Support Government Action
Download Report
 Pennsylvania Medical Debt 2026
Background
In the absence of affordable care options, individuals may find themselves burdened by medical costs. In 2024, nearly 100 million Americans owed over $220 billion in medical debt.[i] Medical debt is largely driven by unaffordable bills: many Americans with private coverage must pay thousands of dollars in out-of-pocket expenses to get care, including increasingly high premiums, deductibles, co-insurance, and copayments.[ii][iii] This lack of affordability is reflected in national survey findings showing that many medical debts stem from one-time or short-term medical expenses that [iv].[v]
Roughly half of adults say they could not pay a $500 unexpected medical bill and would either have to incur debt to pay it or would not be able to pay the bill at all. These factors negatively impact long-term financial security and ability to afford care in the future.
The aim of this brief is to present findings from the Pennsylvania CHESS survey on unexpected medical bills, financial burdens due to medical costs, medical debt, and support for policy solutions. Detailed information on the survey methods, sampling approach, and study population is provided in the Appendix.
Unexpected Medical Bills
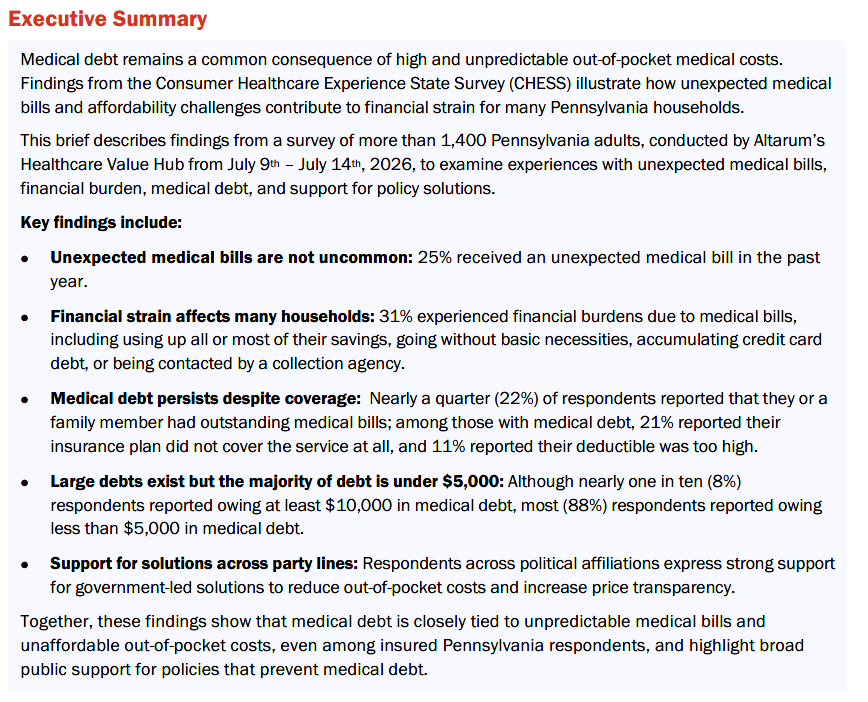
A quarter (25%) of Pennsylvania respondents received an unexpected medical bill in the past year. Among respondents who received an unexpected bill, experiences varied by coverage. Respondents with employer-sponsored and individually purchased insurance (e.g., through the health care Marketplace) most frequently reported an unexpected medical bill (31% and 29%, respectively), followed by respondents enrolled in Medical Assistance, the Pennsylvania Medicaid program (18%) and Medicare (16%).
Financial Burdens Due to Medical Cost
Nearly one-third of Pennsylvania respondents (31%) reported experiencing at least one financial burden due to medical costs in the last year. Higher rates of medical cost-related burden were reported among younger adults, respondents of color, respondents with a disability or who live with a person with a disability, and respondents with Medicaid. The findings in Pennsylvania are similar to what we see across the National CHESS data set regarding the impact of financial burdens from medical costs (Table 1).
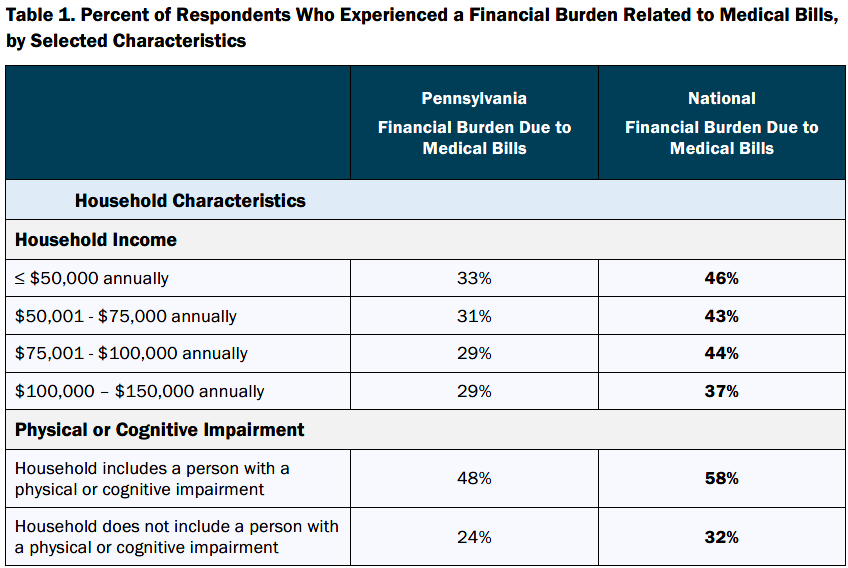
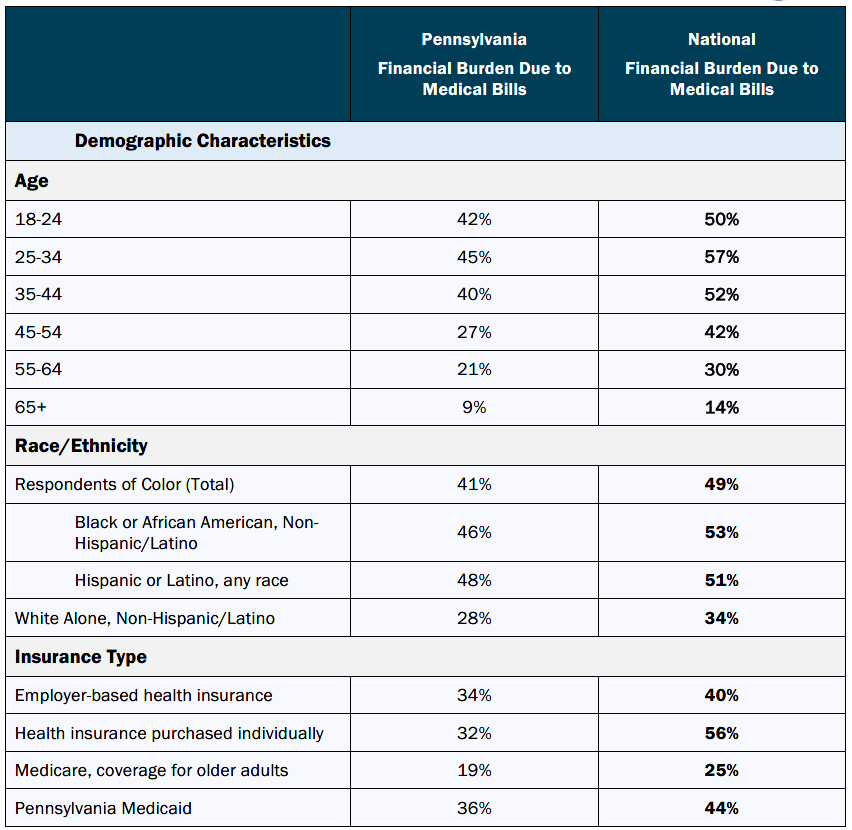
Source: 2026 Poll of Pennsylvania Adults, Ages 18+, Altarum Healthcare Value Hub’s Consumer Healthcare Experience State Survey
Note: The Respondents of Color category includes respondents who are: Black or African American, Hispanic or Latino, American Indian or Native Alaskan, Asian, Native Hawaiian or another Pacific Islander. The quantity of responses for individual groups not shown above were insufficient to report reliable estimates. The Disability Status category includes respondents who responded that they or someone in their household identifies as having a disability or long-term health condition related to mobility, cognition, independent living, hearing, vision, and self-care.
Respondents reported a range of strategies and consequences when trying to manage medical expenses. Ten percent reported using up all or most of their savings, 13% reported being contacted by a collection agency, and 10% reported going without basic necessities like food, heat or housing due to medical bills. Fewer respondents reported borrowing money or taking out a loan or another mortgage on their home (5%), accumulating large amounts of credit card debt (7%), or being placed on a long-term payment plan (7%).
Medical Debt and Health Insurance
Nearly a quarter (22%) of Pennsylvania respondents reported that they or a family member currently have outstanding medical bills. Among respondents with medical debt, the most commonly reported amount was less than $500 (26%), followed by $1,000 to $2,499 (22%), $2,500 to $4,999 (16%), and $5,000 to $7,499 (12%). Nearly a tenth (8%) of respondents reported having incurred more than $10,000 in medical debt.
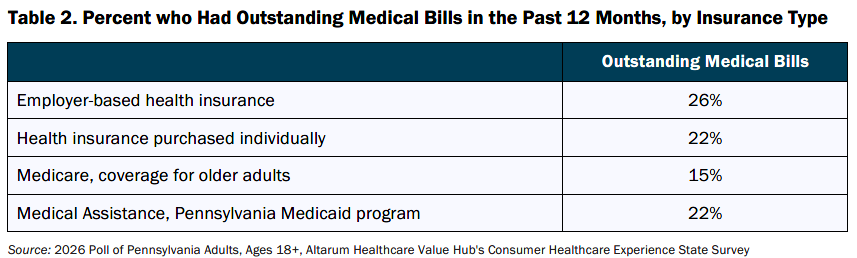
Although most respondents (75%) with outstanding medical bills report being uninsured when they first incurred the debt, a quarter (25%) of respondents reported having insurance when their medical debt was incurred. Among those who were insured and have incurred medical debt in the past twelve months, respondents with employer-sponsored insurance most frequently reported outstanding medical debt (Table 2).
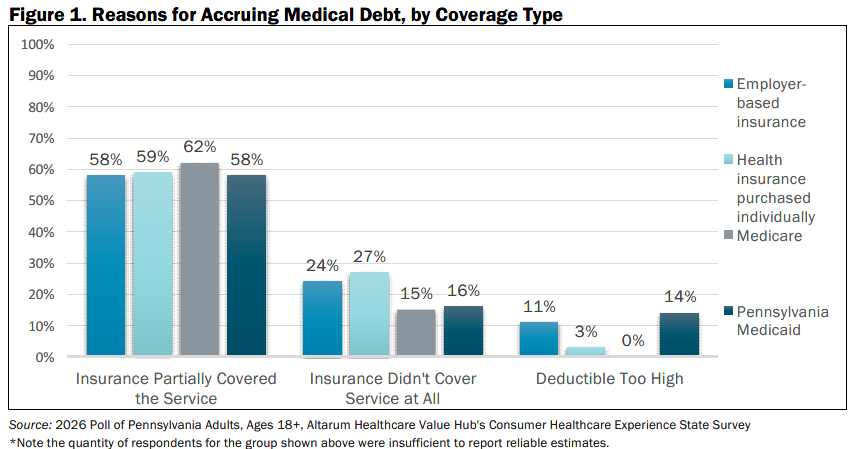
Respondents identified multiple reasons for incurring medical debt, reflecting differences in insurance coverage. Nearly three in five (57%) respondents reported that their insurance only partially covered the cost of care and twenty-one percent (21%) reported that their insurance carrier didn’t cover the service at all.
Notably, larger shares of those with Medicaid and Medicare reported their insurance plan did not cover the service, while employer-sponsored or individually purchased insurance more frequently reported high deductibles as the primary reason for incurring medical debt (Figure 1).
Respondents most frequently identified hospital services (68%) as the source of their medical debt. Other commonly reported sources included laboratory tests such as MRI’s (33%), doctor or technician services in a hospital (31%), doctor or technician services not in a hospital (22%), an urgent care center (16%), and chronic condition management such as physical therapy, pain management, and dialysis (15%).
Differences in Amount and Reasons for Medical Debt
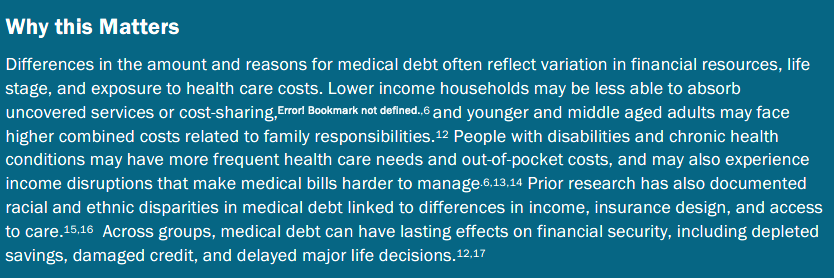
While insurance coverage plays a central role in how medical debt occurs, the prevalence and severity of medical debt also vary across income, age, disability status, and race and ethnicity.
Income
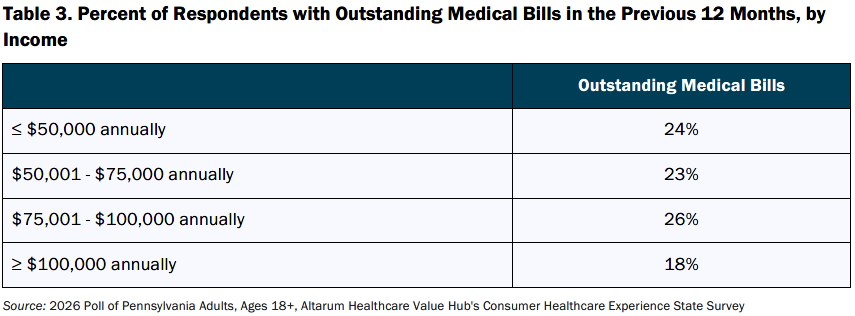
Medical debt was reported across income levels, though both the likelihood of having medical debt and the amounts owed varied by household income (Table 3). Among respondents with outstanding medical debt living in a household earning below $50,0000, four-fifths (80%) reported having $2,500 or less in medical debt, while 6% owe more than $10,000. Notably, a higher proportion of respondents with household incomes above $100,000 per year report owing at least $10,000 in debt (15%) than respondents in any other income bracket.
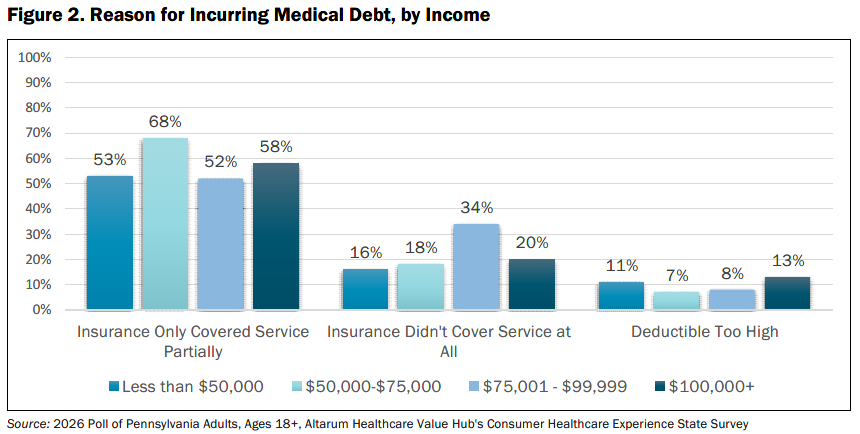
Differences were also observed in the reasons respondents across income stratifications reported for incurring medical debt. While respondents across income groups cited similar reasons overall (Figure 2), respondents earning between $50,000 and $75,000 annually most frequently reported incurring medical debt because services were only partially covered by their insurance (68%), whereas respondents in higher income brackets more often cited high deductibles as a contributing factor (13%).
Age
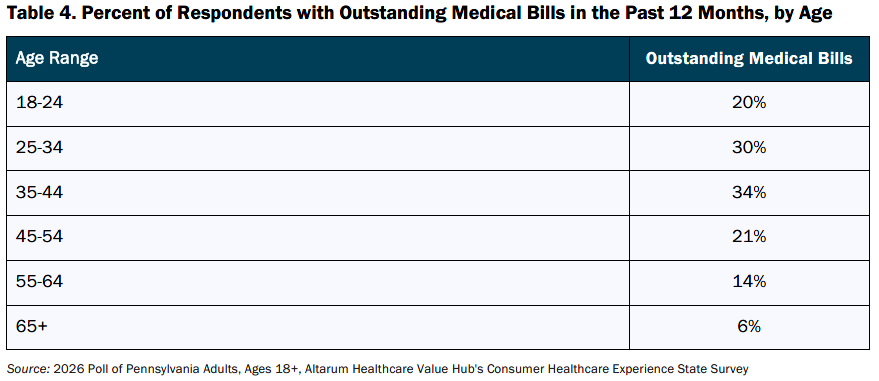
Medical debt prevalence among Pennsylvania respondents also varied by age. Respondents aged 35-44 reported the highest rates of medical debt (34%), followed by those 25-34 (30%) and 45-54 (21%). In contrast, those 65+ reported the lowest rates of medical debt (6%) (Table 4).
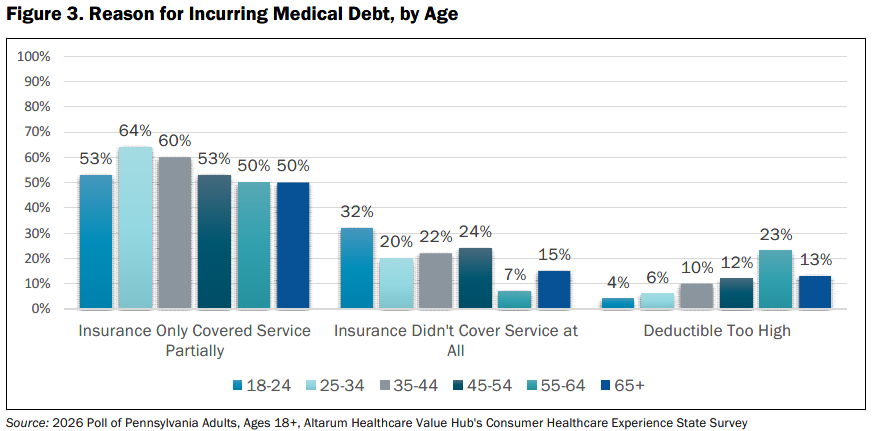
Reasons for incurring medical debt were generally similar across age groups, though the relative importance of specific factors varied (Figure 3). Roughly half of all respondents report incurring medical debt because their insurance plan only partially covered the service(s) they received. Interestingly, higher rates of medical debt due to high deductibles were reported among respondents ages 55-64 (23%).
Disability
Some of the highest rates of medical debt were seen among households that include a person with a disability. Respondents whose households included a member with a disability reported higher rates of medical debt for themselves or their family (34%) compared to those without a disabled household member (17%). Both groups most frequently reported owing less than $500 in medical debt (27% among those with a disability or a disabled household member and 25% of those without).
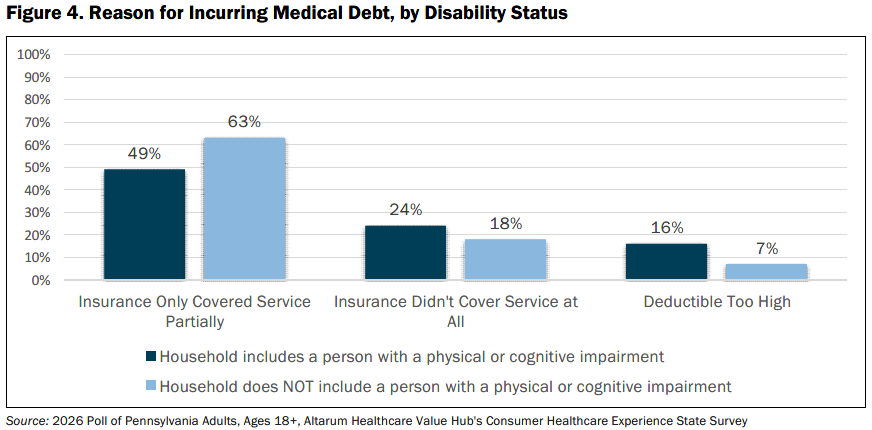
Reasons for incurring medical debt were similar among respondents with or without a household member with a disability. However, compared to respondents without a disability or a disabled household member, respondents with a disability or a disabled household member reported higher rates of medical debt due to non-covered services (24% vs 18%) and deductibles (16% vs 7%) (Figure 4).
Race and Ethnicity
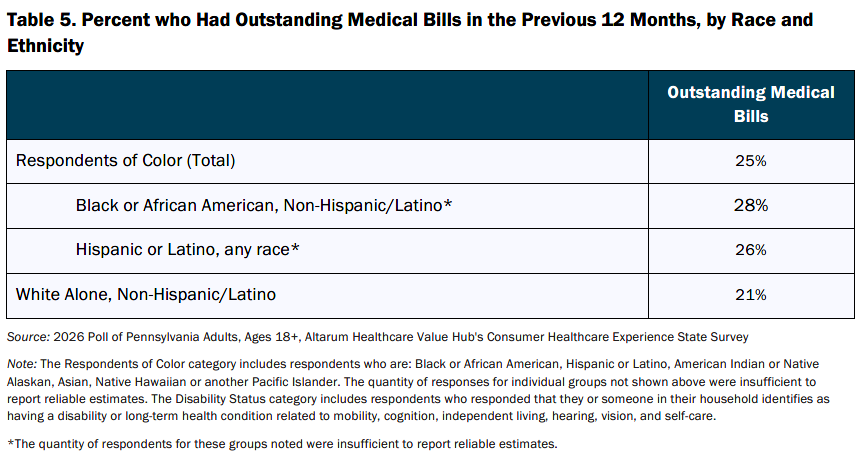
Differences in medical debt exposure were also seen across racial/ethnic groups (Table 5). Respondents of color reported higher rates of medical debt (25%) compared to White alone non-Hispanic respondents (21%). Hispanic/Latino respondents most commonly report owing more than $10,000 in medical debt (22%), followed by Black/African American respondents (15%) and white alone non-Hispanic respondents (8%).
Support for Solutions Across Party Lines
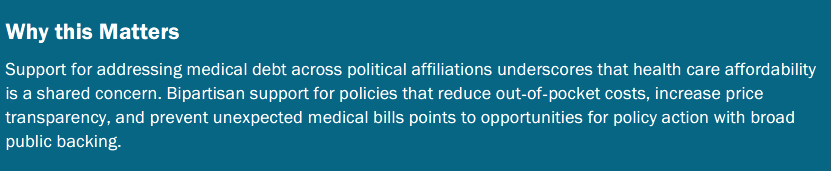
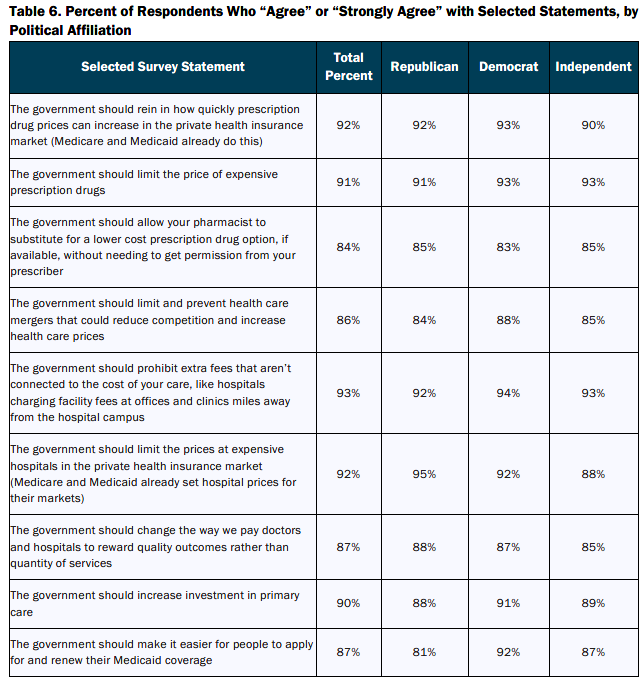
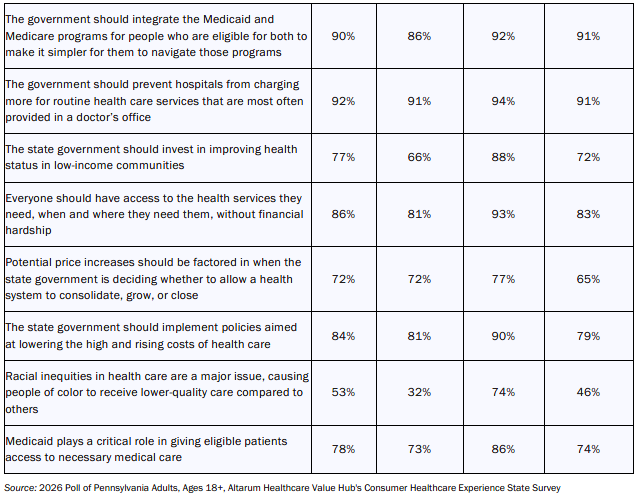
Support for addressing medical debt extended across political affiliations, with respondents expressing strong support for policy approaches aimed at reducing out‑of‑pocket costs, increasing price transparency, and preventing unexpected medical bills (Table 6).
Taken together, these findings indicate that medical debt is widely viewed as a shared affordability challenge and that there is broad public support for policy efforts to prevent medical debt before it occurs.
Conclusion
Findings from the Pennsylvania Consumer Healthcare Experience State Survey show that unexpected medical bills, financial strain, and medical debt are common experiences for Pennsylvania residents. Many respondents reported significant financial burdens related to medical costs, including using savings, taking on credit card debt, or carrying unpaid medical bills.
Medical debt was most often driven by unaffordable out-of-pocket costs, even among respondents with health insurance. Many respondents incurred medical debt because their insurance plan did not cover the service, or because their deductible or co-insurance was too high to afford. Differences in exposure to medical debt were observed across income, age, disability status, and race and ethnicity, underscoring that medical debt affects a wide range of Pennsylvania households.
Respondents across the political spectrum expressed support for policies aimed at reducing out-of-pocket costs, increasing price transparency and preventing unexpected medical bills. Together, these findings highlight medical debt as a shared affordability challenge and point to broad public support for efforts to prevent medical debt before it occurs.
By grounding policy discussions in Pennsylvania residents’ lived experiences, these findings can help state policymakers identify and evaluate strategies that protect consumers from unaffordable out-of-pocket costs and prevent medical debt. For more information on healthcare affordability in Pennsylvania and strategies that survey respondents support, please see Healthcare Value Hub, Pennsylvania Residents Struggle to Afford High Health Care Costs; Worry About Affording Health Care in the Future; Support Government Action across Party Lines, Data Brief (September 2026).
Altarum in Action
Rhode Island Office of the Health Insurance Commissioner cites CHESS survey in letter to State House Committee on Health and Human Services about HB072 related to reimbursement rates and repealing affordability standards. Read more
Washington State Senator Patty Murray’s office cites the WA CHESS survey in press release about Senate Health, Education, Labor and Pensions (HELP) Committee hearing where Senator Murray questioned CEOs of major pharmaceutical companies about the high prices charged to Americans for their prescription drugs. Read more
Read More Altarum in Action Resources