

< View All Healthcare Value Hub Articles
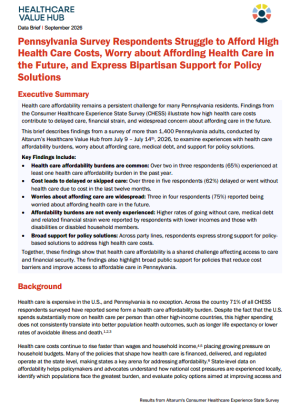
Pennsylvania Survey Respondents Struggle to Afford High Health Care Costs, Worry about Affording Health Care in the Future, and Express Bipartisan Support for Policy Solutions
Download Report
 Pennsylvania Affordability 2026
Background
Health care is expensive in the U.S., and Pennsylvania is no exception. Across the country 71% of all CHESS respondents surveyed have reported some form a health care affordability burden. Despite the fact that the U.S. spends substantially more on health care per person than other high‑income countries, this higher spending does not consistently translate into better population health outcomes, such as longer life expectancy or lower rates of avoidable illness and death.1,,2,3
Health care costs continue to rise faster than wages and household income,4,5 placing growing pressure on household budgets. Many of the policies that shape how health care is financed, delivered, and regulated operate at the state level, making states a key arena for addressing affordability.6 State‑level data on affordability helps policymakers and advocates understand how national cost pressures are experienced locally, identify which populations face the greatest burden, and evaluate policy options aimed at improving access and reducing financial strain. Detailed information on methods and the respondents who took this survey are available in the Appendix.
A Range of Health Care Affordability Burdens
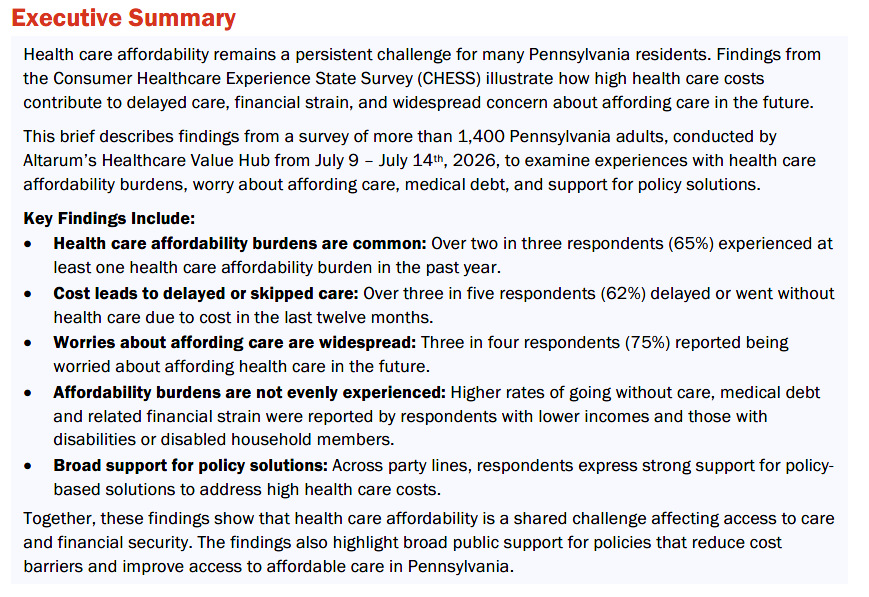
In Pennsylvania, nearly two-thirds (62%) of respondents reported that they, or a family member, skipped or delayed medical care due to cost. This figure is slightly lower than the nationwide percentage; 69% of CHESS respondents across all states surveyed reported forgoing or delaying care due to cost. Among those reporting affordability challenges in Pennsylvania, the most common experiences reported were:
- 25% Cut pills in half, skipped doses of medicine or did not fill a prescription;
- 24% Delayed going to the doctor or having a procedure done;
- 21% Skipped a recommended medical test or treatment;
- 16% Avoided going to the doctor or having a procedure done altogether;
- 11% Skipped needed mental health care;
- 7% Skipped or delayed getting a medical assistive device.
- 2% Skipped needed maternity or reproductive health care; and
Cost was the most commonly cited reason for delaying or foregoing care (20%). However, other barriers also played a role, including the inability to get an appointment (13%) or not being able to get time off of work (10%). Among uninsured respondents, 52% cited the high cost of insurance as the primary reason they remained without coverage, surpassing other commonly reported reasons such believing coverage was unnecessary or not knowing how to enroll.

Differences in Health Care Affordability Burdens
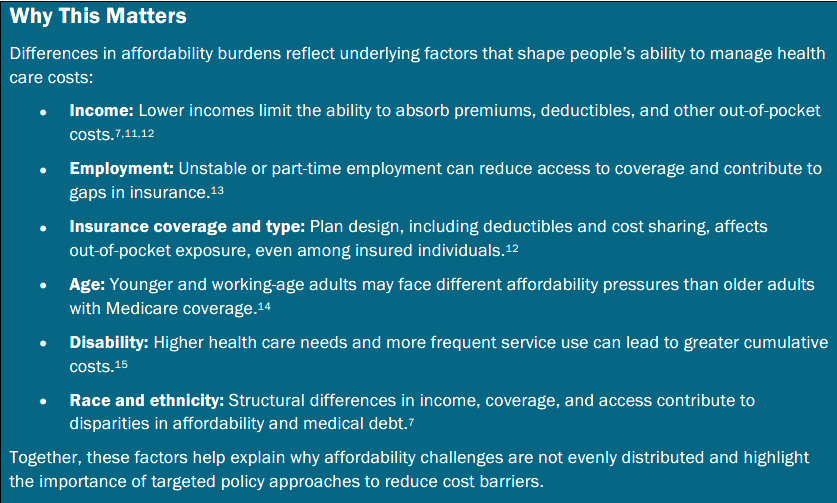
Health care affordability burdens may be experienced differently across income, employment status, insurance coverage, race and ethnicity, age, and disability status. High frequencies of affordability burdens have been reported by CHESS respondents across the country; as a whole, 71% of CHESS respondents across all states surveyed have reported experiencing one or more health care affordability burden(s).
Income and Employment
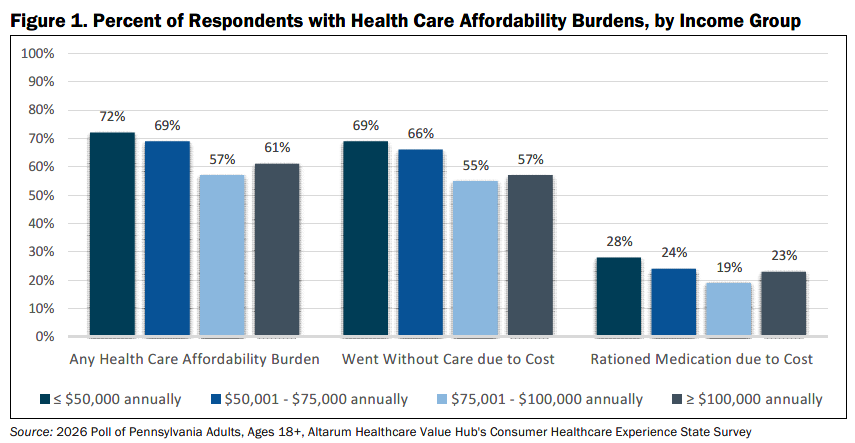
Respondents with lower household incomes reported higher rates of health care affordability burdens than those with higher incomes. In Pennsylvania, nearly three in every four respondents (72%) with an annual household income of less than $50,000 reported experiencing at least one health care affordability burden in the last year. These respondents also reported delaying or forgoing care due to cost more frequently than respondents with higher incomes (Figure 1).
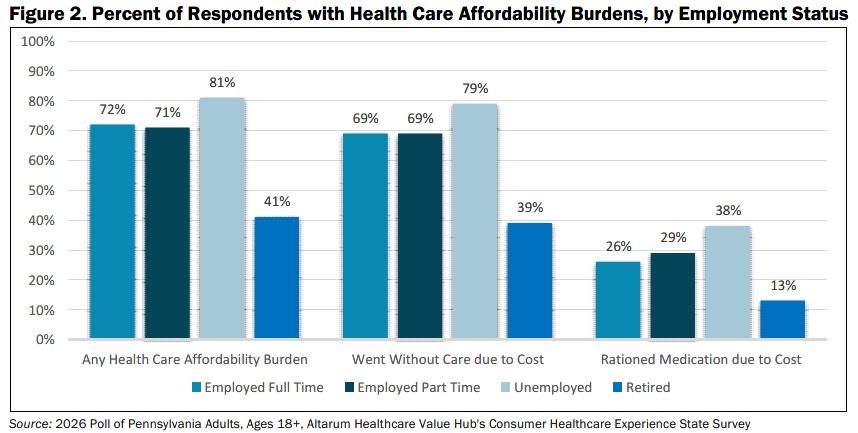
Affordability challenges also impact respondents regardless of employment status. However, respondents who are currently unemployed, but who are seeking work, reported higher rates of experiencing any health care affordability burden, going without care, or rationing medication due to cost compared to those who are employed or who are retired (Figure 2).
Insurance Coverage and Type
Respondents with different forms of coverage reported distinct patterns of cost related barriers, reflecting differences in premiums, cost sharing, and access to covered services. In the National CHESS data set respondents without health insurance coverage, those that purchase their health insurance on the Marketplace, and those on Medicaid experience higher rates of skipping or rationing care. Approximately 20% of Pennsylvania’s population is covered by Medicaid or the Children’s Health Insurance Program (CHIP), which provides subsidized health insurance to people with lower incomes or disabilities.10
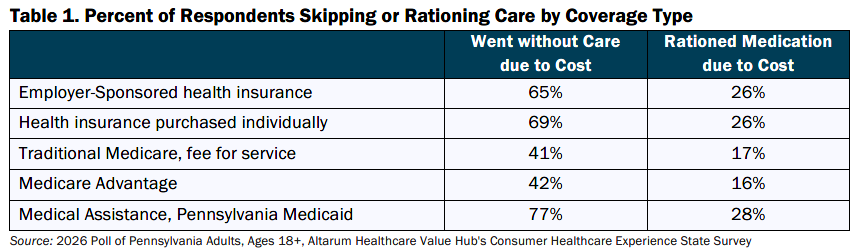
Many respondents expressed strong support for maintaining and strengthening the Medicaid program, including ensuring access for low‑income individuals, people with disabilities, and families. Despite this support, respondents enrolled in Pennsylvania Medicaid reported going without care due to cost more frequently than respondents with other forms of coverage and reported the highest rates of medication rationing, while respondents enrolled in Medicare reported the lowest incidence of rationing medication or going without care due to cost (Table 1).
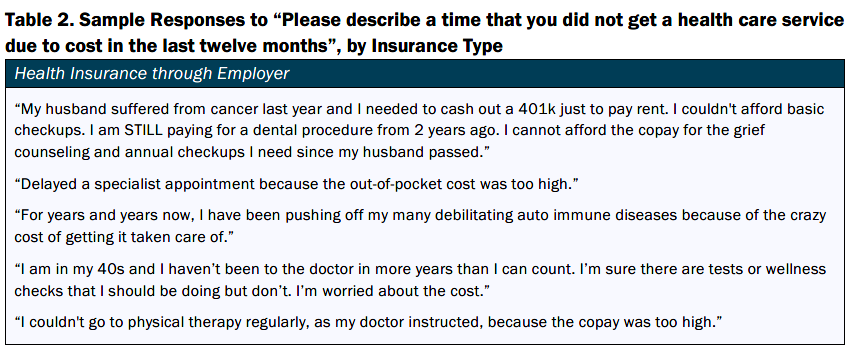
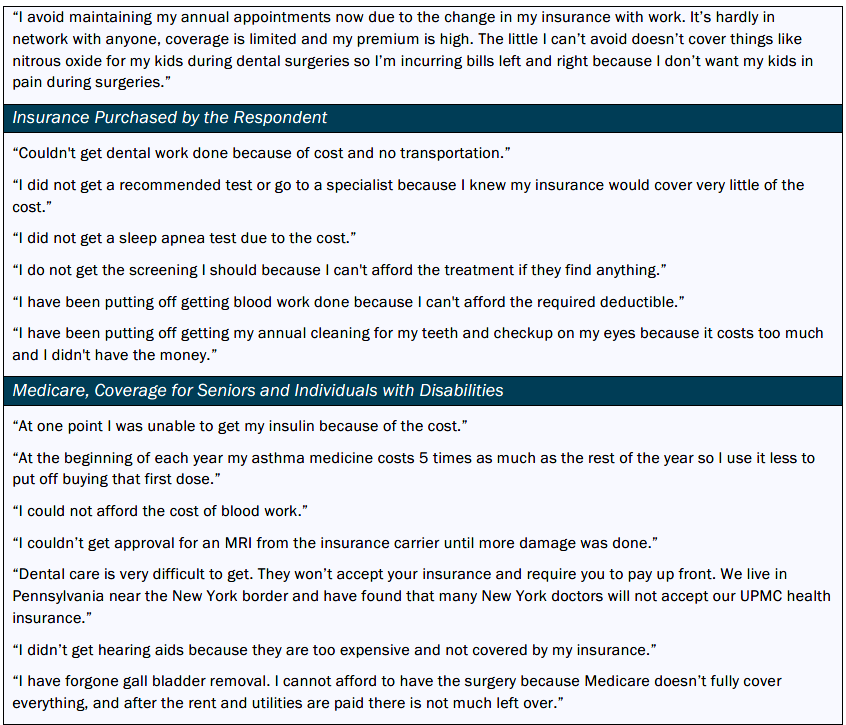
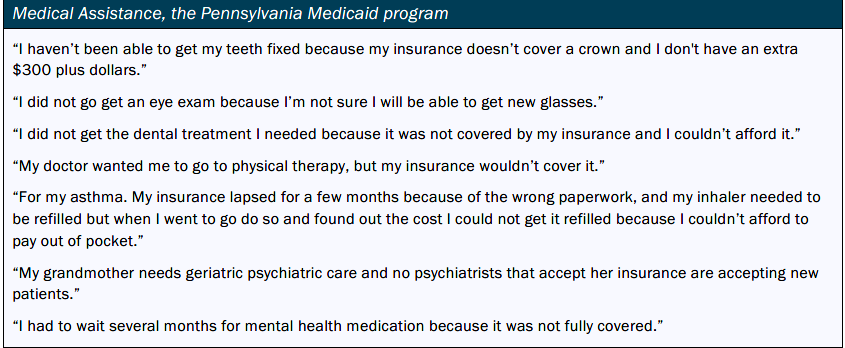
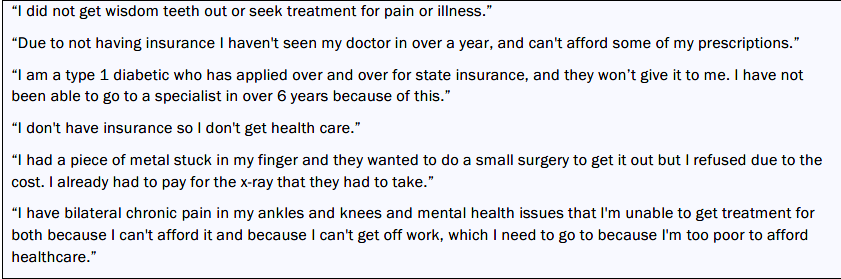
When asked to describe their experiences, some survey participants shared personal accounts of being unable to access necessary health care because of cost. While individuals without health insurance coverage often face the most severe affordability burden, respondents with employer-sponsored coverage, individually purchased plans, Medicare, and Medicaid also described difficulties accessing care due to cost (Table 2).
Table 2. Sample Responses to “Please describe a time that you did not get a health care service due to cost in the last twelve months”, by Insurance Type

Race and Ethnicity
Nationwide CHESS data demonstrates significant differences in respondents’ ability to afford health care. While 71% of all CHESS respondents across all states surveyed report experiencing any health care affordability burden, this figure increases to 82% of all Hispanic, Latino, Black or African American respondents and 84% of all American Indian or Alaskan Native respondents across all states.
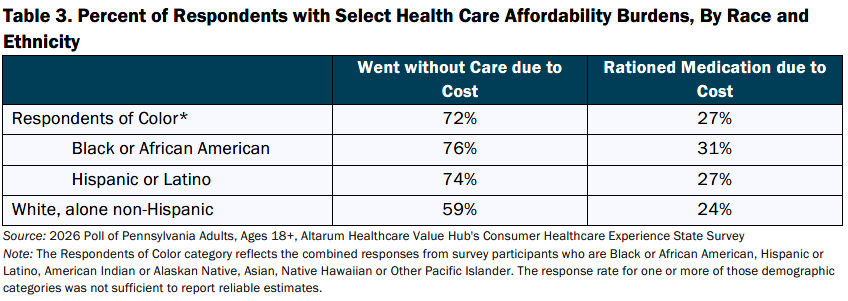
Like the national estimates, respondents of color in Pennsylvania reported higher rates of going without care due to cost than white, non-Hispanic respondents, and higher rates of rationing medication. In the past year, 72% of respondents of color reported forgoing care due to cost, compared to 59% of white, non-Hispanic respondents (Table 3).
Age and Disability
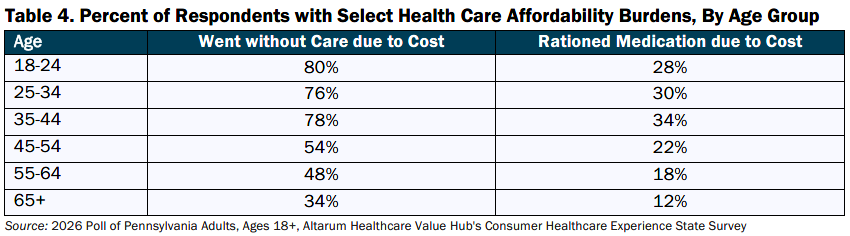
Affordability burdens varied across age groups (Table 4). In Pennsylvania, young adults aged 18-24 reported the highest rates of forgoing care due to cost, though affordability concerns extended across age groups. More than half of respondents under age 55 reported skipping care in the past year due to financial constraints. Similarly, adults aged 35 through 44 reported the highest rates of medication rationing due to cost.
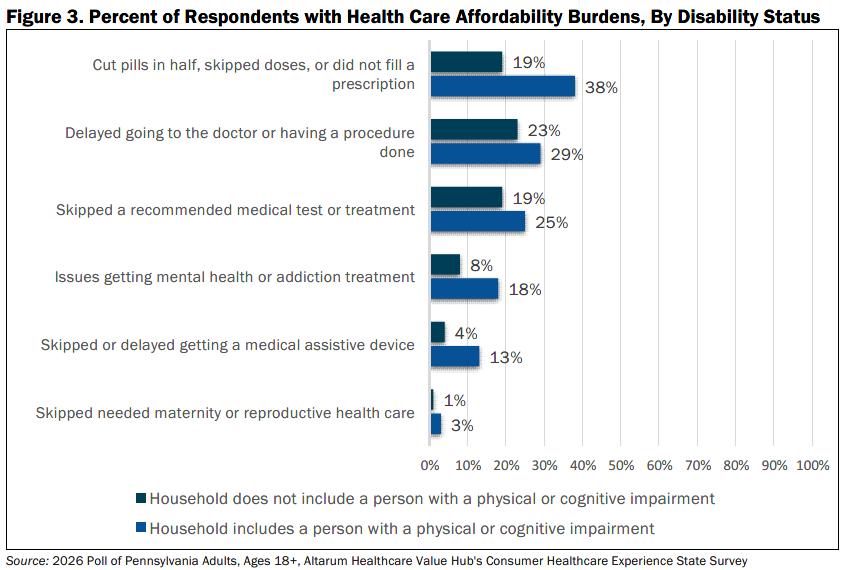
Respondents with a disability, or who lived with someone with a disability, reported higher rates of health care affordability burdens than those in households without a disability. Among disabled respondents, 74% reported going without some form of care and 38% reported rationing medication due to cost in the past year, compared to 57% and 19%, respectively.
At the national level, four in five (81%) CHESS respondents with a disability, or who live with a person with a disability, across all states surveyed reported forgoing or delaying care due to cost, compared to 64% of all CHESS respondents across all states surveyed who do not have a disability or do not live with a person with a disability.
These differences were also reflected in disability-related health needs: 13% of respondents with a disability or with a disabled household member reported delaying the purchase of a medical assistive device (like a wheelchair, cane/walker, hearing aid, or prosthetic limb) due to cost, compared to only 4% of respondents in households without a disability (Figure 3).
Encountering Medical Debt
Although many respondents reported delaying, forgoing, or rationing care due to cost, others did receive care but experienced financial hardship from the resulting medical bills. Nearly a third of respondents (31%) reported experiencing at least one significant financial burden related to medical costs; including using up all or most of their savings (10%), being contacted by a collection agency (13%), going without basic necessities (10%), or borrowing money (5%).
Medical debt‑related financial burdens were more common among lower-income respondents, with roughly one-third (33%) of respondents earning $50,000 or less reporting a financial burden due to medical bills, compared to 29% of those with incomes of $100,000 or more. Additionally, nearly half (48%) of respondents with disabilities or disabled household members reported financial burdens due to medical bills; which is a significant difference compared to those without a disability or a disabled household member, of whom 24% reported financial difficulties due to medical bills.
Among respondents who reported medical debt, a quarter (25%) reported having health insurance at the time the debt was incurred. Common reasons cited included:
- 21%—My insurance didn’t cover the service at all;
- 57%—My insurance only covered a portion of the service, and the remaining bill is too high;
- 11%—My deductible was too high, and I was not able meet it;
- 3%—My coinsurance was too high, and I could not afford to pay it; and
- 1%—The interest rate on the debt is too high.
High Levels of Worry about Affording Care and Coverage
Many respondents in Pennsylvania reported concern about their ability to afford care. These results align with national surveys indicating that concern about affording health care is widespread across the U.S., even among insured adults.7,11 Across the country, 79% of all CHESS respondents reported being concerned about affording the cost of care. This figure slightly exceeds the percentage of Pennsylvania respondents; 75% of Pennsylvania respondents reported being either “worried” or “very worried” about affording some aspect of care in the future.
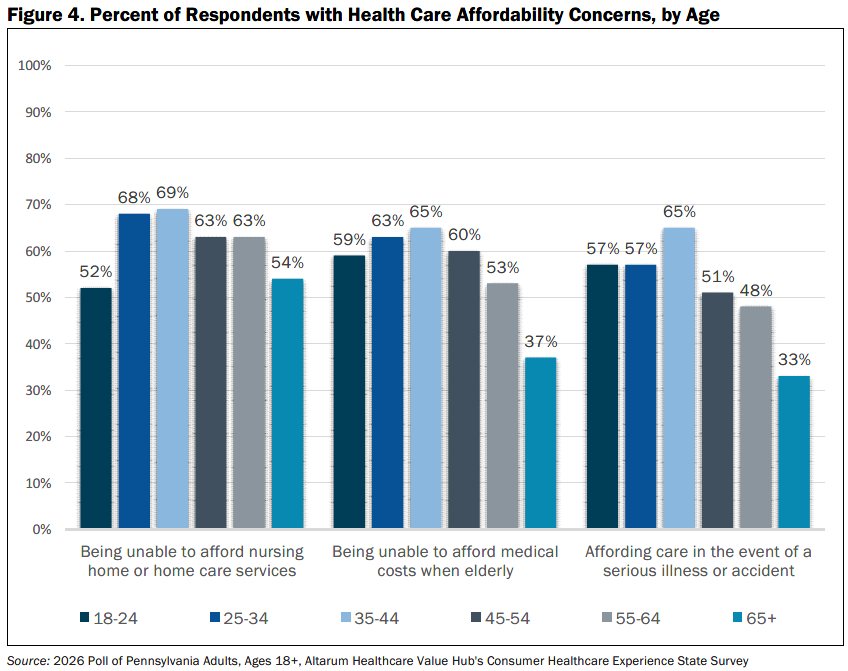
Among the list of eleven potential concerns, respondents most frequently reported being worried about their ability to pay for nursing home or in-home care when needed (62%), medical care in old age (57%), and care following a serious illness or accident (52%). Respondents also reported being worried that their insurance carrier would deny coverage for necessary care (48%), about affording an ambulance ride in an emergency (45%) and affording health insurance itself (44%).
Although concerns about long-term care and medical costs are often associated with older adults, these worries were more frequently reported by younger respondents. For example, 63% of respondents aged 25–34 and 65% of those aged 35–44 expressed concern about being able to afford medical costs when they are older. Likewise, nearly two in three respondents under age 65 (63%) reported being worried about paying for some form of long-term care (Figure 4).
Healthcare Consolidation and Consumer Concerns
In the past year, 38% of respondents reported that they were aware of a merger or acquisition in their community. Among those who noticed changes following a merger or acquisition, 16% reported being responsible for higher out-of-pocket costs (16%), 16% reported providers leaving insurance networks, 24% reported fewer choices of providers, and 14% reported perceived declines in care quality.
When asked about their largest concern related to health care consolidation, respondents most frequently reported:
- 24%—I’m concerned I will have to pay more to see my doctor;
- 22%—I’m concerned I will have fewer choices of where to receive care;
- 20%—I’m concerned my doctor may no longer be covered by my insurance;
- 14%—I’m concerned I will have a lower quality of care; and
- 13%—I’m concerned I will have to travel farther to see my doctor
Together, these concerns highlight how health care consolidation can affect patients’ access, choice, and out‑of‑pocket costs.
Support for Policy Solutions
Respondents expressed strong support for changes to address high and rising health care costs. Nearly three-quarters (83%) agreed or strongly agreed that “the system needs to change.”
When asked which issues the government should prioritize in the coming year, respondents most frequently identified health care (58%), the economy and joblessness (53%), and affordable housing (40%). Among health care-specific priorities, respondents most often selected addressing high health care costs, including ensuring everyone has access to healthcare coverage (40%), hospital costs (37%), and ensuring access to care when needed (36%).
Respondents most frequently identified drug companies (75%), health insurance companies (72%), and hospitals (56%) as responsible for high healthcare costs, while 41% also viewed state government as playing a role.
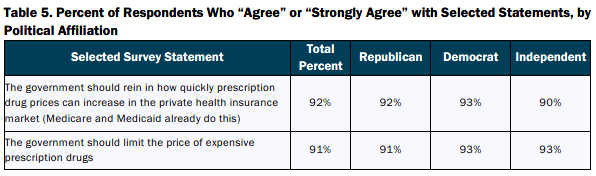
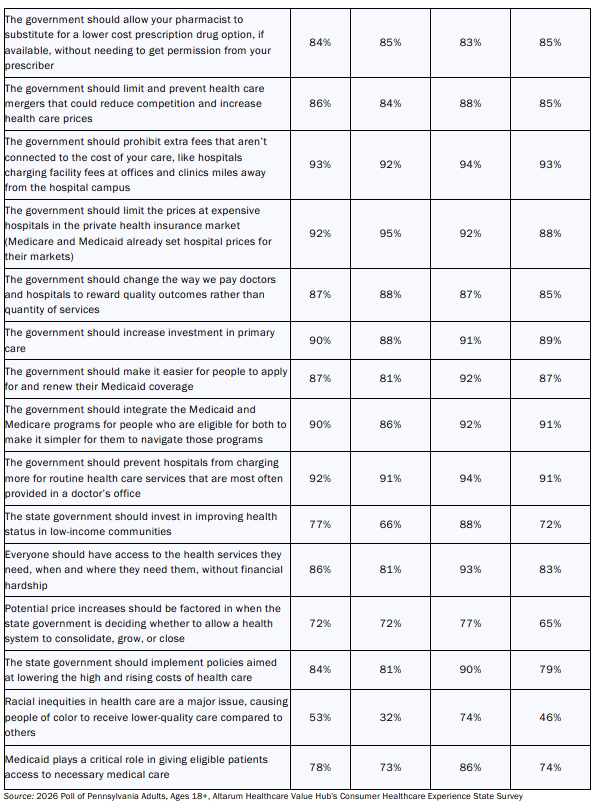
Support for policy approaches to address health care costs was strong across political affiliations. Respondents across parties endorsed a range of strategies to reduce out-of-pocket costs, increase price transparency, promote competition, and strengthen access to coverage (Table 5).

Conclusion
Findings from the Pennsylvania Consumer Healthcare Experience Survey show that high health care costs remain a significant barrier to accessing care and maintaining financial security for many residents. While affordability challenges were widespread, some groups experienced a disproportionate burden.
At the same time, respondents across political affiliations shared common concerns about rising health care costs and expressed broad support for policy approaches to improve affordability, including lowering out‑of‑pocket costs, increasing price transparency, strengthening coverage, and promoting competition.
Together, these findings highlight health care affordability as a shared concern with implications for access, financial security, and long‑term health, and demonstrate how state‑level data can inform efforts to improve access to affordable, high‑quality care.
Altarum in Action
Rhode Island Office of the Health Insurance Commissioner cites CHESS survey in letter to State House Committee on Health and Human Services about HB072 related to reimbursement rates and repealing affordability standards. Read more
Washington State Senator Patty Murray’s office cites the WA CHESS survey in press release about Senate Health, Education, Labor and Pensions (HELP) Committee hearing where Senator Murray questioned CEOs of major pharmaceutical companies about the high prices charged to Americans for their prescription drugs. Read more
Read More Altarum in Action Resources