Making Healthcare Affordable: Finding a Common Approach to Measure Progress
Healthcare affordability is a long-standing, top-of-mind worry for consumers.1 Surveys show that up to one-third of Americans report postponing needed care due to cost, two-thirds of insured Americans report difficult affording deductibles and one-quarter report difficultly affording out-of-pocket copayment or coinsurance obligations.2 The incoming administration has promised to broaden healthcare access, make healthcare more affordable and improve the quality of the care available to all Americans.3
But what does it mean to make healthcare affordable or even more affordable? These considerations are particularly urgent as “consumerism” is increasingly embraced—promoting high deductibles and increased consumer cost sharing.
Surprisingly, there is no standard definition of affordability in healthcare that can be readily used for policy purposes.4 Instead, there is a patchwork of inconsistent program standards and a diversity of opinions on what constitutes affordability. Yet clear standards are important to realizing policy goals. For example, in 1965, the Office of Economic Opportunity adopted poverty thresholds as a working definition of poverty in order to operationalize President Johnson’s War on Poverty.5 While there are valid criticisms of federal poverty levels (FPL), this measure lended clarity to the policymaking process and evaluation of outcomes.
Creating healthcare affordability standards may seem like an inherently subjective exercise—what seems affordable to some may not seem affordable to others of similar means—but evidence and experts suggest that it is both possible and useful to explore this question. This Research Brief explores the background on health affordability and suggests evidence-based criteria for defining an affordability standard in healthcare.
Components of an Affordability Standard
There are some basic, common-sense criteria that give direction to an affordability standard but stop short of being definitive.
Goal: Remove Financial Barriers to Care
The first step to establishing an affordability standard is to determine the goal towards which we strive. In the past, policymakers have often prioritized increasing enrollment.6 But standards limited to premium costs may successfully increase the rate of insured consumers without actually providing better access to affordable care. Some consumers are finding that affording insurance is just the first hurdle in affording care. Both uninsured and insured adults report struggling to pay medical bills (53% and 20%, respectively).7 For these reasons, healthcare affordability standards must include out-of-pocket costs in addition to premiums.
Specifically, to meet the goal of increasing access to affordable care, policymakers should establish an affordability standard that determines the percentage of income a household can devote to healthcare (in total, and separately for):8
- Cost for coverage (premiums)
- Cost-sharing for covered services
- Cost of needed services not included in the benefit package
Adjust for Income and Family Size
Affordability standards must be grounded in real world data showing that the ability to afford coverage and healthcare varies with income and family size. For example:
- Lower-income families must devote a larger share of their income to meeting basic needs, compared to higher-income families. Put another way, low-income families have very limited discretionary income after covering basic needs.9
- Lower-income families have fewer liquid assets to meet a large medical expense. One recent study found that the nonelderly Americans with incomes between 100 and 250 percent of FPL had net financial assets of $326, while those with incomes between 250 and 400 percent of FPL had net assets of $2,089.10 Similarly, a Pew survey found that one in three American families reported having no savings at all, and 41 percent did not have enough liquid savings to cover a $2,000 financial shock.11 Further, public policy should not punish lower-income people for savings they have managed to accumulate for other necessities, such as education, housing and retirement.
- As the EPI budget calculator shows, budgets rise significantly with family size, since more children require more housing, health care, and child care.12
Use Program Data/Natural Experiments to Establish Thresholds
The common sense criteria above stop short of telling us where to set affordability thresholds. Robust experiments to establish price sensitivity for various types of families have not been conducted since the 1970s.13
Yet we have a wealth of program data and natural experiments that can begin to inform these thresholds. Below we examine how existing programs incorporate affordability thresholds. This review shows that our country uses a diversity of affordability standards—suggesting that not all are targeted appropriately.
The Federal Income Tax Code
One of the oldest healthcare affordability considerations is in our tax code. A deduction for medical expenses was first enacted as part of the United States Revenue Act of 1942, limited to those expenses which exceeded 5 percent of adjusted gross income (AGI) and subject to a cap.14
Today, for a filer who itemizes tax deductions, unreimbursed medical expenses are deductible to the extent that they exceed 10 percent of the filer’s AGI (up from 7.5% prior to 2013).15 Deductible expenses include insurance premiums and out-of-pocket payments to providers (e.g., doctors and hospitals). Note that because it is a deductible rather than a tax credit, eligible expenses are not fully subsidized when they exceed the 10 percent threshold; they merely serve to reduce taxable income.
Medicaid
Medicaid, enacted in 1965, was originally linked to the receipt of cash assistance and not to an independent income standard. Since the 1980s, financial eligibility has been determined by income and assets—a means-tested program.16 To comply with basic requirements for receiving federal Medicaid funds, states must provide free or very low-cost Medicaid the to following populations:
- pregnant women and children below age six with incomes below 133 percent of the federal poverty level (FPL);
- school-aged children with incomes below 100 percent of FPL;
- working parents with incomes below 28 percent of FPL;
- Medicare beneficiaries with incomes below the poverty level, or in some cases slightly above (known as “dual eligibles”);
- seniors and individuals with disabilities receiving Supplemental Security Income (SSI) up to 75 percent of FPL (generally); and
- certain other groups (like foster children) regardless of income.
Children's Health Insurance Program
The Children’s Health Insurance Program (CHIP), enacted in 1997, is designed to provide coverage for uninsured children in families with incomes that are modest, but too high to qualify for Medicaid—generally those below 200 percent of FPL. States may cover families at higher income levels using income “disregards.”17 Federal CHIP guidelines limit a family’s total healthcare costs (premium, deductibles, copayments) to 5 percent of family income.18
Massachusetts Health Insurance Connector Authority
In 2006, Massachusetts became the first state to enact near-universal health coverage. In crafting the program, the state’s exploration of affordability standards focused on premium costs, not only as a means of assisting lower-income families with health coverage costs but also to establish parameters for relief from the adult coverage mandate. Premium subsidies were originally offered to families up to 300 percent of FPL, later extended to 400 percent of FPL.
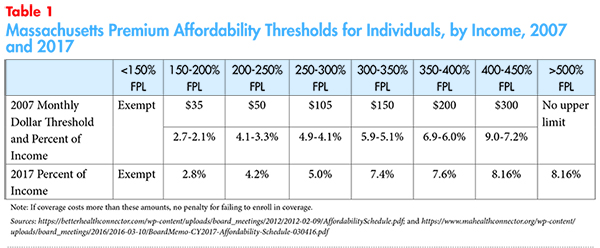
The Commonwealth Health Insurance Connector Authority is responsible for evaluating and updating a premium affordability schedule every year, and these standards have evolved over time.19 For example, the 2007 affordability standard was based on a dollar threshold for each income bracket and later replaced with a percent-of-income threshold (see Table 1).
The standards employed by the program succeeded in bringing the uninsured rate down to the lowest levels in the country. For 2017, the Health Connector considered including cost sharing into the affordability determination and automatic indexing of affordability standards into the most recent affordability schedule, but ultimately decided against implementing these options for the time being.20,21
Healthy San Francisco
In 2007, San Francisco became the first city to seek universal health access. Healthy San Francisco provides residents access to a range of services by providers in San Francisco. The program is available to city residents age 18 and over with incomes up to 400 percent of the federal poverty level that are uninsured and not eligible for Medi-Cal or Medicare.22
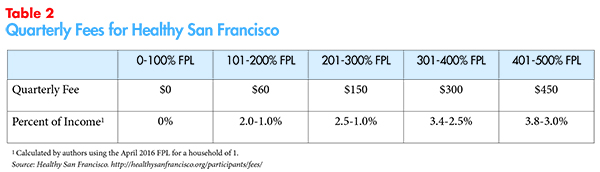
To access health services, participants pay a quarterly fee, in addition to a point-of-service fee for doctor visits, prescriptions and emergency department (ED) visits. Both the quarterly fees and the point-of-service fees vary by family income and those with incomes below 100 percent of FPL pay no quarterly fees (see Table 2), and extremely limited point-of-service fees. The program does not have a mandate to enroll in coverage.
The participant fee schedule set by the city allowed for robust enrollment. By 2011, 70 percent of the city’s uninsured adult population was enrolled in the Healthy San Francisco program and 76 percent of enrollees accessed primary care. Moreover, over a two-year period, hospital admissions decreased by 14.4 percent, acute hospital days by 35 percent and average length of stay by 26 percent.23
COBRA Subsidies
Temporary federal subsidies for COBRA premiums were enacted as part of the 2009 stimulus package. The full 65 percent subsidy was only available for individuals with a modified adjusted gross income of less than $125,000. A reduced subsidy is available if the individual’s modified adjusted gross income is between $125,000 and $145,000. For joint filers, the subsidy phases out at incomes between $250,000 and $290,000. Aside from filing status, there was no consideration of family size and no consideration of income gradations below the $125,000 and $250,000 thresholds.
Despite the substantial subsidy, a majority of eligible individuals did not enroll in COBRA.24 Researchers found that educated, middle- to upper-income, male workers saw the greatest uptake during this time.25
The Affordable Care Act (ACA)
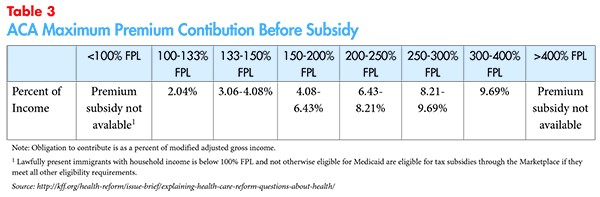
The ACA, passed in 2010, used affordability thresholds to guide supplemental federal funding for health insurance costs, to enforce an adult coverage mandate and to measure the affordability of employer-sponsored insurance premiums. The law took affordability considerations higher up the income stream than any prior federal effort, with sliding-scale subsidies available for up to 400 percent of FPL for insurance coverage purchased through the Marketplaces (Table 3).26 The law also provided cost-sharing subsidies to families up to 250 percent of FPL.
But the ACA is inconsistent with respect to affordability thresholds.
- The ACA’s standard for being exempt from the tax penalty is set at a maximum of 8.13 percent of household income. In other words, if the lowest-priced coverage available costs more than 8.13 percent of household income, no tax penalty is assessed if a person does not have coverage.27
- Those with an offer of employer coverage cannot access marketplace subsidies—no matter how low their income—unless the individual health plan offered by their employer has a premium that costs more than 9.66 percent of their income. There is no separate affordability standard for dependents with an offer of family coverage (sometimes referred to as the family glitch).28
Discussion
The affordability thresholds in the ACA represent our nation’s most comprehensive effort to date to provide a level of protection from unaffordable health coverage and healthcare costs.
Retrospective data show the Affordable Care Act increased coverage, increased access to care and reduced the risk of an unaffordable medical expense. For example, the Commonwealth Fund found that fewer Americans had skipped needed healthcare because of the cost, from about 16 percent of working-age adults in 2013 to about 13 percent by the end of 2015.29 Moreover, these gains were largest in states that expanded Medicaid. In contrast to the increase in use of routine healthcare, there was little expansion in the use of dental care among adults, which is not a required benefit under the ACA.30
But as many have noted, affordability problems remain. The leading reason that people don’t enroll in coverage is “because it’s too expensive.”31 (Note: some in this group were unaware of financial assistance; also, premium costs were the leading reason for not enrolling in coverage prior to implementation of the ACA.) Failure to expand Medicaid (21 states) is a large source of remaining affordability problems, but data from other programs suggests the thresholds built into the ACA may merit revisiting.32
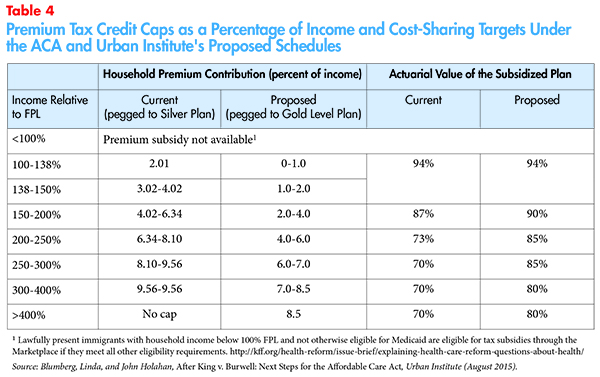
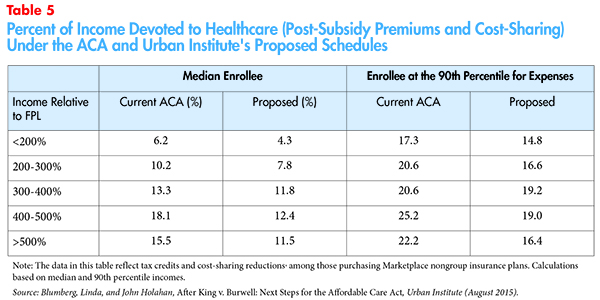
Researchers at the Urban Institute noted that the ACA cost less than originally projected and explored more generous affordability thresholds (premium and cost-sharing) that would keep program costs within the original budget (Table 4).33 The Urban analysis provides some key data points that incorporate both the premium and point-of-service costs faced by families.
The Urban Institute modeled the combined financial burden for families, reflecting both premium costs and expected cost sharing. The proposed changes would reduce overall financial obligations as indicated in Table 5.
As indicated above, Massachusetts explicitly considers healthcare affordability criteria and augments the federal standard with state dollars to bring a more generous threshold to its residents—achieving the highest rate of coverage of any state. Similarly, when New York introduced its Basic Health Plan in 2016 the state anticipated enrolling more than 470,000 residents in the first year by reducing monthly premiums costs and out-of-pocket costs for residents with incomes at or below 200 percent of FPL.34 In order to understand where to set affordability thresholds, we need to exploit existing and past variation in program standards to more rigorously understand how enrollment and access responded to the varying affordability thresholds.
Harmonize Across Programs
In the interests of basic fairness, once standards have been established, we should harmonize our approach to subsidizing coverage and healthcare across various coverage programs and tax treatments. This means:
Affordability standards should be harmonized across public programs with respect to premium contributions, cost sharing, and obligations for non-covered services.
Individual mandates to have coverage (if present) should tie their financial hardship exemption to the same spending caps as connected to subsidies.
Access to subsidies for those with employer coverage should use the same affordability test as used for non-group subsidies; workers and their dependents should have access to similar standards.
Employers whose coverage offering features high cost sharing should consider letting employees premium obligations adjust with income.35
Favorable tax treatment of healthcare expenses and premiums should be aligned and slide with income, if possible. This invites a re-examination of the advantageous tax treatment associated with employer coverage (no income tax due on employer-paid premiums, or expenses paid through FSAs, HSAs, or HRAs). This tax benefit is estimated to be almost $150 billion in 2016.36 Unfortunately, for equity goals, this is a regressive subsidy with the largest benefit flowing to the highest-income, highest tax bracket families.
Can We Afford Affordability Standards?
The development of affordability standards is fraught with the implied obligation to subsidize coverage and healthcare costs so that families’ remaining financial obligation conforms with the standards. For several reasons, this should not distract us from the task. For one, campaign promises to make healthcare affordable must be accompanied by universal clarity on how we define affordability. For another, it has been amply demonstrated that we currently pay healthcare prices that are out of step with the value of the service, drug, or device and far too much spending goes to low-value care and waste. Efforts to get our nation to affordable healthcare must use both subsidies and a concerted effort to address the underlying cost of care.
Moreover, the exercise of setting standards and harmonizing across programs may find that some Americans are currently over-subsidized – such as high-wage earners who benefit from tax free compensation in the form of employer provided health coverage and HRAs, as well as tax advantaged spending through FSA and HSA accounts.37
Conclusion
Healthcare costs have been a significant concern for Americans for several decades. Survey data show that far too many Americans face healthcare affordability problems.
Many reform efforts should be lauded for their success in making healthcare more affordable but the time has come to define what affordable healthcare looks like in terms of what families can afford and our nation’s goals for enrollment in coverage and affordable access to healthcare. Setting standards so that consumers do not face financial barriers getting the right care at the right time pays dividends to employers and communities and may reduce society’s healthcare spending down the road.
Before the next healthcare reform debate is concluded, state and federal policymakers should embrace a uniform, harmonized, evidence-based standard of affordability. Common sense and data on the financial liquidity of families suggest:
- Standards must embrace the cost of premiums, cost sharing, and vital health services that may not covered. To do otherwise invites policies that trade off one type of affordability for another.
- Standards must reflect families’ real-world financial limitations and must slide with income and family size, with lowest-income families having the lowest financial obligation.
- Standards should be broadly applied and harmonized across programs. Selected sub-populations cannot be left behind.
A key companion step to getting to affordability is to address waste in the system and health care prices that are unconscionably high. Affordability considerations should be accompanied by multi-payer efforts to bring down the underlying cost of care and to fund population health measures at the appropriate level.
Notes
1. More than 4 in 10 say they are dissatisfied with the total cost they pay for their healthcare (42%) and are worried about being able to pay medical costs for themselves and their family in the coming year (43%). 42% of consumers believe healthcare is the most unaffordable household expense. Politico-Harvard T.H. Chan School of Public Health Poll, Americans’ Views on Current Trade and Health Policies (September 2016). DiJulio, Bianca, Jamie Firth and Mollyann Brodie, Kaiser Health Tracking Poll, Kaiser Family Foundation (October 2015).
2. Collins, Sara, et al., The Problem of Underinsurance and How Rising Deductibles Will Make It Worse, The Commonwealth Fund (May 20, 2015). See also, Collins, Sara, et al., Too High a Price: Out-of-Pocket Health Care Costs in the United States, The Commonwealth Fund (October 2014).
3. Trump Pence Healthcare Reform platform. Accessed on Dec. 28, 2016. Available at https://www.donaldjtrump.com/positions/healthcare-reform
4. Glied, Sherry A., Mandates and the Affordability of Health Care, NBER Working Paper No. w14545 (December 2008).
5. Willis, Jessie, How We Measure Poverty, Oregon Center for Public Policy (February 2000).
6. We note that there are many ways to boost enrollment in addition to subsidies, such as the provision of enrollment assistance.
7. Key Facts About the Uninsured Population, Kaiser Family Foundation (Sept. 29, 2016). http://kff.org/uninsured/fact-sheet/key-facts-about-the-uninsured-population/
8. Adapted from http://www.communitycatalyst.org/doc_store/publications/affordable_health_care_for_all_apr07.pdf. Similar, http://www.communitycatalyst.org/doc-store/publications/affordability_brief_cc_pico.pdf (July 2009).
9. The 2011 Discretionary Spend Report, Experian Simmons (2011). Available at: https://www.experian.com/assets/simmons-research/white-papers/2011-discretionary-spend-report.pdf
10. Claxton, Gary, Matthew Rae, and Nirmita Panchal, Consumer Assets and Patient Cost Sharing, Kaiser Family Foundation (March 11, 2015).
11. http://www.pewtrusts.org/~/media/assets/2015/11/emergencysavingsreportnov2015.pdf
12. Gould, Elise, et al., What Families Need to Get By: The 2013 Update of EPI’s Family Budget Calendar, Economic Policy Institute (July 2013).
13. Newhouse JP, et al., “Some Interim Results from a Controlled Trial of Cost Sharing in Health Insurance,” New England Journal of Medicine (December 1981).
14. Erb, Kelly Phillips, “Deduct This: The History of the Medical Expenses Deduction,” Forbes (June 20, 2011).
15. Individuals 65 and over can use the former 7.5% floor until Jan. 1, 2017. Lowry, Sean, Health-Related Tax Expenditures: Overview and Analysis, Congressional Research Service (Jan. 8, 2016).
16. Congress modified eligibility in the late 1980's in an effort to expand Medicaid coverage of pregnant women and children by delinking Medicaid eligibility from receipt of AFDC. See: http://www.policyalmanac.org/health/archive/hhs_medicaid.shtml
17. The 2009 reauthorization Act provides for a lower level of federal match (the Medicaid match rate) for SCHIP enrollees whose effective family income exceeds 300 percent of FPL.
18. Social Security Act, Title XXI Subtitle J Section 2103. States have discretion to set actual cost sharing under the 5% maximum.
19. Massachusetts General Laws Chapter 176Q, Section 3(q). Board of the Commonwealth Health Insurance Connector Authority Minutes (March 10, 2016). https://www.mahealthconnector.org/wp-content/uploads/board_meetings/2016/2016-05-12/Minutes-031016.pdf Also, Woltmann, Marissa, Health Connector Board of Directors Memorandum (March 4, 2016). (Detailed Chart) Available at: https://www.mahealthconnector.org/wp-content/uploads/board_meetings/2016/2016-03-10/BoardMemo-CY2017-Affordability-Schedule-030416.pdf
20. The Health Connector considered inclusion of cost-sharing to be too administratively burdensome for implementation. In terms of avoiding the individual mandate penalty, opponents of inclusion feared residents would struggle to estimate cost-sharing and determine the amount of total spending.
21. The Affordable Care Act included automatic indexing of affordability thresholds.
22.Prior to 2015, eligibility was extended to those below 500 percent of FPL. http://healthysanfrancisco.org/wp-content/uploads/2014-2015-HSF-Annual-Report.pdf
23. Delvecchio, Finley, and Tangerine Brigham, “Creating a Network of Care, Healthy San Francisco Connects Uninsured Residents to a Primary Care Home,” Healthcare Executive (May/June 2011). See also: Catherine McLaughlin, et al., Evaluation of Health San Francisco: Final Report, Mathematica Policy Research (Aug. 21, 2011). http://healthysanfrancisco.org/wp-content/uploads/Evaluation-of-HSF-Aug-2011.pdf
24. Ilana Graetz, COBRA ARRA Subsidies: Was the Carrot Enticing Enough? Urban Institute. Available at: http://www.urban.org/sites/default/files/alfresco/publication-pdfs/412172-Federal-Subsidy-for-Laid-Off-Workers-Health-Insurance.PDF.
25. http://scholarship.claremont.edu/cgi/viewcontent.cgi?article=1448&context=cmc_theses
26. Explaining Health Care Reform: Questions About Health Insurance Subsidies, Kaiser Family Foundation (Nov 1, 2016).
27. The 8.13 percent ceiling applies to individuals or the cost of family coverage if the tax return has uncovered family members in the filing unit. See: https://www.healthcare.gov/exemptions-tool/#/results/2016/details/employer-affordability.
28. Linda J. Blumberg and John Holahan, After King v. Burwell: Next Steps for the Affordable Care Act, Urban Institute (August 2015).
29. Susan Hayes, et al., A Long Way in a Short Time: States’ Progress on Health Care Coverage and Access, 2013- 2015, The Commonwealth Fund (Dec. 21, 2016).
30. Ibid.
31. Key Facts About the Uninsured Population, Kaiser Family Foundation (Sept. 29, 2016). Available at: http://kff.org/uninsured/fact-sheet/key-facts-about-the-uninsured-population/
32. The affordability thresholds built into the ACA were not the result of an explicit consideration of affordability considerations but rather a budgeting imperative. As the law moved through the legislative process, the goal was to keep the federal cost under $1.0 trillion over the 10- year budget window.
33. Blumberg, Linda J., and John Holahan, After King v. Burwell: Next Steps for the Affordable Care Act, Urban Institute (August 2015).
34. New York State Department of Health, Essential Plan New York’s Basic Health Plan (December 2015). Available at: https://www.health.ny.gov/health_care/managed_care/essential/docs/2015-dec_annual_rpt.pdf
35. While rare, some large employers (such as Pitney Bowes and General Electric) offer wage-based premiums. See: http://www.foxbusiness.com/features/2014/01/21/higher-paid-workers-get-bigger-bills-for-group-health-insurance.html
36. Estimates of Federal Tax Expenditures for Fiscal Years 2015-219, Joint Committee on Taxation (Dec. 7, 2015).
37. he foregone federal tax revenue attributed to the exclusion of contributions to employer-based health insurance is estimated to be $3.4 trillion between 2014 and 2023, or 1.5 percent of GDP (CBO 2013). In contrast, over the 2014–2019 period, during which the bulk of the ACA was to be implemented, federal spending was estimated at $855 billion, which amounted to 0.73 percent of gross domestic product (GDP). See: http://www.urban.org/sites/default/files/alfresco/publication-pdfs/2000328-After-King-v.-Burwell-Next-Steps-for-the-Affordable-Care-Act.pdf

HEALTHCARE VALUE HUB
The Healthcare Value Hub can help you find free, timely information about policies and practices to achieve health systems that are equitable, affordable, and focused on the goals and needs of the people the system is meant to serve.
Share
![]()
![]()
![]()

Follow
![]()
![]()


![]()