The Price Isn’t Right: Strategies to Address High and Rising Healthcare Prices
When U.S. healthcare prices are compared to those in other countries or when healthcare price growth is compared to the growth of non-healthcare commodities, there is general agreement that prices seem excessive. Early efforts to quantify excessive prices stem from the Institute of Medicine’s identification of “pricing failures” as a category of healthcare waste, which occur when the price of a product or service exceeds “the cost of production plus a reasonable profit.”1 Using this definition, researchers estimate that excess prices drive $230-$240 billion in wasteful healthcare spending each year (as of 2019).2
The evidence is clear that year-over-year increases in the prices of healthcare services—not the number of services provided—is the primary driver of high annual healthcare spending growth. High spending growth is most prevalent in the commercial insurance market and, particularly, for payments related to outpatient hospital services and prescription drugs.3
States, in their role as regulators and payers, and commercial insurers are important actors that can help keep healthcare prices in check. Evidence-based strategies available to these actors—depending on the market power of local providers—are described in this report.
The Role of Concentrated Markets
Competition—or lack thereof—plays a large role in determining how much providers, drug companies and device manufacturers can charge for their products and services. It also affects the set of solutions that are available for states and commercial payers to address high and rising unit prices.
Over the past several years, consolidation through mergers and acquisitions has increased providers’ market power and strengthened their ability to negotiate higher prices in their contracts with payers, regardless of the quality of care they provide. A 2016 Federal Trade Commission report found that hospitals that held monopolies charged 15 percent more than those with four or more competitors. Hospitals with one or two competitors charged 5-6 percent more than those with four or more competitors.4
Similarly, drug manufacturers have been accused of charging exorbitant prices for drugs when competition is limited.5 Studies show that the prices of brand name drugs decline to nearly half their original cost after two generics enter the market, and a third of their original cost once five generics enter the market.6
Public scrutiny and concern over market domination have increased in recent years in response to growing evidence of anti-competitive and anti-consumer business practices,7 in addition to widespread affordability problems creating barriers to coverage and care.8
Strategies to Address High Prices When Provider/Product Competition Exists
Certain forms of price transparency-like peer comparisons and reference pricing-can lower prices when there are multiple competitors in a market. These strategies are effective because they single out high-priced providers, incentivizing them to lower their prices to better align with their competitors.
Peer Comparisons
Provider “peer comparisons” are commonly employed to control unnecessary utilization, but anecdotal evidence suggests that they can motivate high-cost providers to lower their prices as well.9 Prior to 2010, payments to New Hampshire’s most expensive hospital exceeded those of its competitors by nearly 50 percent. The state’s largest insurer had been unable to decrease prices due to the hospital’s prominent reputation and loyal patient base, however, evidence of excessive prices—made public on the state’s price transparency website—enabled the insurer to brand the hospital as a pricing outlier, garner public support and negotiate lower prices. Market observers testified that, despite limited public awareness of the price transparency tool, publicly identifying high-priced providers shifted the balance of power towards the state’s insurers and narrowed price variation over time.10
Reference Pricing
Reference pricing strives to contain healthcare costs by establishing a “reference price” that a payer will contribute towards the cost of a certain procedure. Patients are free to select their desired provider but are required to pay expenses in excess of the established amount. While the primary goal is to incentivize patients to seek care from lower- to moderately-priced providers, a now famous study from the California Public Employees’ Retirement System (CalPERS) showed that high-priced providers of knee and hip replacement surgeries lowered their prices to meet the established rate in order to remain competitive.11
Public and private payers can increase the likelihood that the strategy will lower prices by focusing on procedures that are routine, elective and non-urgent; are offered by many providers; have high variation in prices; have little variation in quality; and are widely identified as the appropriate mode of treatment for a particular condition.12 Additionally, resources should be provided to ensure that patients can easily locate high-quality providers meeting the reference price.
A potential limitation is that reference pricing—like other forms of price transparency—could cause low-price providers to raise their prices to meet the market rate. However, this phenomenon has not been widely observed.13
Myth: Consumer-Facing Price Transparency and Payment Reform Suffice to Lower Excess Prices
It is commonly argued that other strategies, such as consumer-facing price transparency and provider payment reform, suffice to lower excess prices. While consumer-facing price transparency tools help keep consumers safe in the market by allowing them to plan ahead for a medical expense, they have not been shown to put downward pressure on healthcare prices.14 In fact, some patients perceive high prices as a sign of better quality, diluting the effectiveness of this approach.15 Other factors-like insurance coverage that distances consumers from the cost of their care and trusted relationships between patients and their clinicians-also decrease the likelihood that consumers will make decisions based solely on cost. Similarly, little evidence supports the claim that provider payment reforms, such as pay-for-performance programs, lower healthcare prices. Rather, these programs typically seek to improve quality and/or address utilization problems, with mixed success.16
Additional Considerations
As demonstrated by the New Hampshire example on page 2, the presence of more than one provider in a market may not be enough to create price competition. The same holds true for the pharmaceutical industry, where “shadow pricing” occurs when lower-priced manufacturers increase the price of a drug to align with higher-priced competitors.17 In these cases, states should look to the next set of solutions—strategies to lower prices when competition is scarce.
Strategies to Address High Prices When Provider/Product Competition Does Not Exist
According to the Commonwealth Fund, approximately 90 percent of provider markets (including hospitals, specialists and primary care physicians) were either highly or “super” concentrated as of 2017.18 Given the link between consolidation and higher prices,19 regulators and payers need solutions that do not rely on the threat of taking business away from a provider or product manufacturer. The following strategies show potential to (1) lower the price of a single service, (2) cap the price of a bundle of services or (3) limit price growth, even in situations when competition is scarce.
Strategies to Lower the Price of Individual Services
Tie Provider Payments to Medicare Rates
Commercial sector prices are often compared to Medicare prices in order to gauge their reasonableness. Although imperfect, Medicare prices are a used as a benchmark because the program makes an effort to set prices based on the cost of production, plus a reasonable profit.20
States can leverage their negotiating power as major employers to tie the prices that providers charge state employee health plans to Medicare rates. For example, Montana capped payment for all hospital services at an average of 234 percent of Medicare rates beginning in 2016, saving the state approximately $15.6 million in the second year of implementation.21
Hospital/Physician Rate Setting
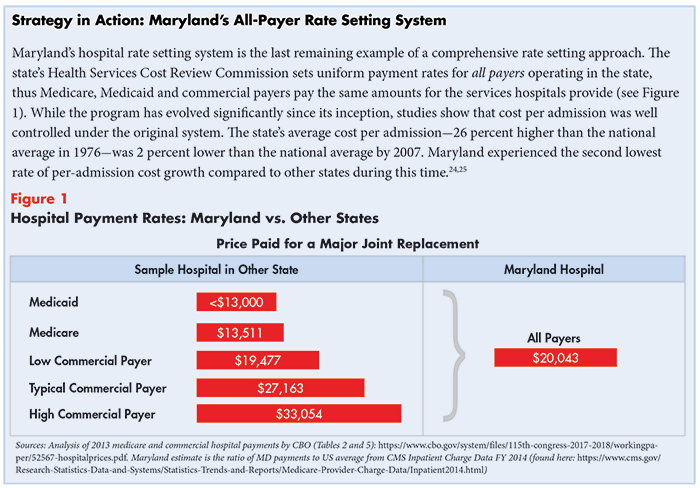
Hospital or physician rate setting is a process by which an authority, usually a state agency, establishes uniform rates for hospital or physician services and controls the growth of payment levels over time. Several states-including New York, Massachusetts, New Jersey, Maryland, Washington, Connecticut and West Virginia-experimented with rate setting as a means of controlling healthcare price growth in the 1970s and 1980s, however only Maryland continues the practice today.22
Despite a decline in popularity, studies show that rate setting is a highly effective means of cost control, particularly when the programs account for volume growth that may develop in response to rate limits. Broad legislation that allows regulators flexibility to design and evolve the system over time; enforcement mechanisms such as penalties for non-compliance; and support from a broad coalition of stakeholders also contribute to the initiatives’ success.23
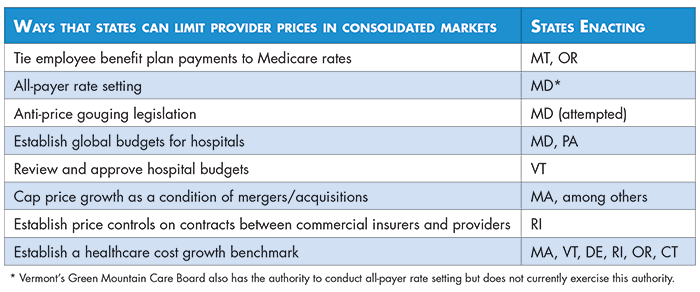
Anti-Price Gouging Legislation
Pharmaceutical manufacturers and pharmacy benefit managers have come under fire for various practices that stifle competition and raise prices.26 In recent years, several states have introduced legislation to prevent harmful, and even unethical, activities such as “price-gouging”—when a manufacturer uses its competitive advantage to charge unreasonably high prices for “essential off-patent or generic drugs.” In May 2017, Maryland became the first state to pass such legislation (applicable only to generic drugs), which was struck down on constitutional grounds.27 In 2019, the U.S. Supreme Court declined to consider the Maryland Attorney General’s appeal. No other state has passed similar legislation as of 2020.
Strategies to Cap the Price of a Bundle of Services
Global Budgets
Global budgets are a payment model in which providers—typically hospitals—are paid a prospectively set, fixed amount for the total number of inpatient, outpatient and emergency services provided annually. Hospitals are responsible for expenditures in excess of the set amount in addition to quality outcomes, thus creating an incentive to reduce unnecessary utilization and invest in prevention.
Maryland has incorporated global budgets into its long-running all-payer rate setting program with notable success.28 A 2019 evaluation showed that “the model reduced hospital costs [to the Medicare program] without shifting costs to other parts of the Maryland healthcare system outside the global budgets,” producing $975 million in savings to the Medicare program compared to a control group. Hospital expenditures for commercially insured patients also grew more slowly than the control group, however, the savings were offset by increased spending on professional services.29
Other states, like Pennsylvania, are now testing global budgets’ effectiveness in a non-rate setting environment. Pennsylvania’s plan differs from Maryland’s in that it focuses exclusively on rural hospitals, which generally face limited competition due to provider shortages. As of late 2020, the Pennsylvania Rural Health Model has yet to be evaluated.30
Strategies to Limit Price Growth
Review and Approve Hospital Budgets
Vermont’s legislature charged the Green Mountain Care Board (GMCB) with reviewing and approving hospital budgets as a mechanism to slow healthcare cost growth in 2012. Each year, the GMCB sets growth targets limiting the rate that hospitals’ net patient revenue, chargemaster prices and fixed prospective payments (if applicable) are allowed to increase over the previous year.31 The targets account for a number of factors, including community needs, service utilization and hospitals’ overall financial health.32
Hospitals can request increases in the amount their budgets are allowed to grow. Increases may be permitted if the GMCB deems necessary, for example, if “extra money is needed to fulfill government mandates or if the expense meets other standards that the Board has set.”33 By law, the GMCB has strong enforcement authority to keep hospitals within their budgets, including the ability to impose financial penalties and take hospitals to court.
Prior to the hospital budget review, net patient revenue grew an average of 7.3% per year (from 2005-2013). Net patient revenue growth fell to an average of 4.0% per year after the practice began.34 Differences in the budgets hospitals have requested versus those approved range from over $160,000 to $17 million per year, generating significant savings for the state’s healthcare payers, including consumers, over time.35
Price Caps as a Condition of Healthcare Mergers
Healthcare organizations typically argue that mergers improve efficiency and create economies-of-scale, improving quality and reducing costs, yet little reliable evidence supports this claim.36 In fact, ample evidence demonstrates that healthcare mergers increase prices and that less competition leads to lower quality.37
States often place conditions on healthcare mergers in an attempt to mitigate potential anti-competitive effects.38 These conditions, delivered in the form of consent decrees, may include prohibitions against raising prices above certain thresholds for a specified period of time. Evidence suggests that price caps as a condition of healthcare mergers are effective, but typically only in the near-term. Once the period of regulation is over, providers tend to increase their prices-reversing the desired effect.39
|
Strategy in Action: Price Caps as a Condition of Healthcare Mergers The Massachusetts’ Attorney General’s office’s Bureau of Health Care and Fair Competition negotiated a consent decree that included price caps, among other conditions, in Beth Israel Deaconess Medical Center’s 2018 merger with Lahey Health.40 The agreement prohibits the newly formed entity from increasing prices higher than the state’s 3.1% healthcare cost growth benchmark each year for seven years. The Massachusetts Health Policy Commission estimates that the requirement will save more than $1 billion over the regulated period.41 |
Impose Price Controls on Contracts between Commercial Insurers and Providers
Rhode Island’s Office of the Insurance Commissioner created affordability standards in 2010 that imposed price controls on contracts between commercial insurers and providers. The price controls included annual price inflation caps (equal to the Medicare price index plus 1 percent) for inpatient and outpatient services and transitioned traditional hospital payments to value-based payments offering a fixed fee for a given type of diagnosis and inpatient stay. A 2019 study published in Health Affairs found that the price controls contributed to a decline in total spending growth and out-of-pocket spending from 2007 to 2016.42
Establish a Healthcare Cost Growth Benchmark
Some states have established statewide spending targets (also known as benchmarks) to constrain total hospital or healthcare spending growth.43 Massachusetts was the first state to create a total healthcare spending benchmark in 2012 and a few others-Vermont, Delaware, Rhode Island, Oregon and Connecticut-have followed suit. While data from Massachusetts shows that even voluntary targets can reign in healthcare spending growth,44 mandatory targets may be even more impactful. Complementary quality benchmarks, such as those established in Delaware, are also important to ensure that efforts to reduce spending growth do not negatively impact health outcomes.
Note: Monitoring growth in spending, as opposed to growth in prices, allows states to assess trends in utilization over time. This is important because providers can maintain or reduce their prices for particular services, but increase the number of services provided, to generate more revenue. The provision of unnecessary services contributes to wasteful spending on behalf of patients, insurers and employers.45
Conclusion
Researchers, policymakers and consumer advocates have long been aware that healthcare prices are not commensurate with the quality of care and outcomes we receive. High and rising prices strain state and federal budgets, crowding out other important investments, and financially burden consumers through increased health insurance premiums, cost-sharing, taxes and wages diverted to fund employer-sponsored insurance. Moreover, a significant portion of consumers report delaying or forgoing needed care due to cost, undermining the fundamental mission of a system intended to support health.
As competition ceases to effectively deter excess prices, states must increase their reliance on price controls to rein in high and rising healthcare costs, while keeping a close eye on healthcare utilization and quality. This brief highlights promising strategies from across the country to advance knowledge sharing between states.
Notes
1. Yong, Pierre L., Robert S. Saunders, and LeighAnne Olsen (Eds.), The Healthcare Imperative: Lowering Costs and Improving Outcomes, National Academies Press, Washington, D.C. (2010).
2. Shrank, William H., Teresa L. Rogstad, and Natasha Parekh, “Waste in the US Health Care System: Estimated Costs and Potential for Savings,” JAMA, Vol. 322, No. 15 (Oct. 15, 2019).
3. Health Care Cost Institute, 2018 Health Care Cost and Utilization Report, Washington, D.C. (Feb. 2020).
4. “FTC: Hospital Mergers and Acquisitions May Create Monopolies,” RevCycleIntelligence, https://revcycleintelligence.com/news/ftc-hospital-mergers-and-acquisitions-may-create-monopolies (accessed on Nov. 9, 2020).
5. Krishnan, Sunita, Prescription Drug Competition Hampered by Policies, Barriers and Delay Tactics, Altarum Healthcare Value Hub, Washington, D.C. (December 2017).
6. Kaiser Health News, Government-Protected ‘Monopolies’ Drive Drug Prices Higher, Study Says, https://khn.org/news/government-protected-monopolies-drive-drug-prices-higher-study-says/ (accessed on Jan. 4, 2021).
7. Examples of anti-consumer practices by providers include suing patients and garnishing wages to collect unpaid medical bills and claiming possession of bail money after sued patients are jailed for failing to appear in court. See: Simmons-Duffin, Selena, When Hospitals Sue For Unpaid Bills, It Can Be ‘Ruinous’ For Patients, NPR, Washington, D.C. (June, 25, 2019); “You Wouldn’t Think You’d Go to Jail Over Medical Bills”: County in Rural Kansas is Jailing People Over Unpaid Medical Debt, CBS News, New York, N.Y. (Feb. 9, 2020).
8. In many states, a majority of residents report having one or more healthcare affordability burdens in the past 12 months, including inability to afford coverage, rationing healthcare due to cost, or receiving care but being unable to afford the resulting medical bills. For more information, see: Altarum Healthcare Value Hub, Consumer Healthcare Experience State Survey, Washington, D.C. (2020).
9. Hunt, Amanda, Non-Financial Provider Incentives: Looking Beyond Provider Payment Reform, Altarum Healthcare Value Hub, Washington, D.C. (February 2018).
10. Quincy, Lynn, and Amanda Hunt, Revealing the Truth about Healthcare Price Transparency, Altarum Healthcare Value Hub, Washington, D.C. (June 2018).
11. Robinson, James, and Timothy Brown, Evaluation of Reference Pricing: Final Report, letter to David Cowling of CalPERS (May 15, 2013).
12. Slevin, Geraldine, and Julie Silas, Creating a Consumer-Friendly Reference Pricing Program, Consumers Union, Yonkers, N.Y. (Aug. 2014).
13. Altarum Healthcare Value Hub, Reference Pricing, https://healthcarevaluehub.org/improving-value/browse-strategy/reference-pricing/ (accessed on Oct. 18, 2018). See also: Quincy and Hunt (June 2018).
14. Quincy and Hunt (June 2018).
15. A 2016 survey conducted by Public Agenda showed that a substantial minority of consumers conflated price and quality; those who had compared prices before getting care were more likely to think that higher prices are related to higher quality care. See: Philips, Katherine, David Schleifer, and Carolin Hagelskamp, “Most Americans Do Not Believe That There is an Association Between Health Care Prices and Quality of Care,” Health Affairs, Vol. 35, No. 4 (April 2016).
16. Altarum Healthcare Value Hub, Pay for Performance (P4P), https://healthcarevaluehub.org/improving-value/browse-strategy/pay-performance-p4p (accessed on Jan. 5, 2021).
17. Krishnan (Deccember 2017).
18. Additionally, researchers found that providers’ bargaining power exceeded insurers’ in 58.4 percent of the markets studied, whereas insurers’ bargaining power exceeded that of providers in only 5.8 percent of the markets studied. See: Fulton, Brent D., Daniel R. Arnold and Richard M. Scheffler, Market Concentration Variation of Health Care Providers and Health Insurers in the United States, The Commonwealth Fund, New York, N.Y. (July 30, 2018).
19. Cooper, Zack, et al., “The Price Ain’t Right? Hospital Prices and Health Spending on the Privately Insured,” Quarterly Journal of Economics, Vol. 134, No. 1 (February 2019). See also: Dafny, Leemore, Kate Ho, and Robin S. Lee, “The Price Effects of Cross-Market Mergers: Theory and Evidence from the Hospital Industry,” The Rand Journal of Economics, Vol. 50, No. 2 (April 10, 2019).
20. Whether Medicare prices are an appropriate benchmark for rate setting is debated. The Hub’s Medicare Rates as a Benchmark: Too Much, Too Little or Just Right? explores the pros and cons of this approach: Bhatnagar, Sabah, Medicare Rates as a Benchmark: Too Much, Too Little or Just Right?, Altarum Healthcare Value Hub, Washington, D.C. (February 2020).
21. Appleby, Julie, “‘Holy Cow’ Moment Changes How Montana’s State Health Plan Does Business,” Kaiser Health News (June 20, 2018).
22. Murray, Robert, and Robert A. Berenson, Hospital Rate Setting Revisited, Urban Institute, Washington, D.C. (November 2015).
23. Ibid.
24. Murray, Robert, “Setting Hospital Rates to Control Costs and Boost Quality: The Maryland Experience,” Health Affairs, Vol. 28, No. 5 (September/October 2009).
25. Maryland’s all-payer system has evolved drastically since 2007, starting with the introduction and expansion of global payments in 2008 and 2014.
26. Altarum Healthcare Value Hub, High Drug Spending: What’s the Prescription?, https://healthcarevaluehub.org/advocate-resources/high-drug-spending/ (accessed on Oct. 18, 2018).
27. The 4th circuit court overturned the law on the grounds that it “regulates trade that happens beyond Maryland’s borders, and so is prohibited by the so-called dormant commerce clause.” See: Duncan, Ian, “Maryland Law Against Price-Gouging by Drug Companies is Unconstitutional, Appeals Court Rules,” The Baltimore Sun (April 13, 2018).
28. Johnson, et al. (May 2020).
29. Haber, Susan, et al., Evaluation of the Maryland All-Payer Model, Volume 1: Final Report, RTI International, Waltham, M.A. (Nov. 2019).
30. Centers for Medicare & Medicaid Services, Pennsylvania Rural Health Model (Jan. 16, 2020). See also: Centers for Medicare & Medicaid Services, Fact Sheet: Pennsylvania Rural Health Model (Sept. 18, 2020).
31. Net patient revenue is the total amount of money that a hospital receives for patient services after accounting for contractual allowances, commercial discounts and free care. Chargemaster prices are the list prices that hospitals claim their services are worth, which often serve as the basis for negotiations between hospitals and commercial insurance providers. Fixed prospective payments are advance payments that Vermont hospitals participating in an Accountable Care Organization may elect to receive to provide care for a specific group of patients for a specified period of time.
32. Green Mountain Care Board, The Green Mountain Guide to Hospital Budget Review, Montpelier, V.T. (August 2012). See also: Green Mountain Care Board, Hospital Budget Review, Montpelier, V.T. (August 2020).
33. Ibid.
34. Average calculated from 2013-2020. See: Green Mountain Care Board, Hospital Budget History, Montpelier, V.T. (Nov. 12, 2020).
35. Ibid.
36. A few studies have documented modest price reductions after mergers among providers, however, the reliability of the data source used is debated. See: Cooper, Zack, et al., Webinar on Hospital Mergers with Nonpartisan Research Experts, Yale Tobin Center for Economic Policy, New Haven, C.T. (Sept. 4, 2019).
37. Ibid. See also: Lopez, Eric, Matthew Rae, and Tricia Neuman, What We Know About Provider Consolidation, Kaiser Family Foundation (Sept. 2, 2020).
38. Hunt, Amanda, When Antitrust Fails: Limiting Consumer Harm from Healthcare Consolidation, Altarum Healthcare Value Hub, Washington, D.C. (October 2019).
39. Berenson, Robert A., et al., Addressing Health Care Market Consolidation and High Prices, Urban Institute, Washington, D.C. (Jan. 13, 2020).
40. Ibid.
41. Kacik, Alex, “Beth Israel Deaconess and Lahey Health Complete Merger,” Modern Healthcare (March 1, 2019).
42. Baum, Aaron et al., “Health Care Spending Slowed After Rhode Island Applied Affordability Standards to Commercial Insurers,” Health Affairs, Vol. 38, No. 2 (February 2019). See also: Rhode Island Office of the Health Insurance Commissioner, Reform and Policy-Affordability Standards, http://www.ohic.ri.gov/ohic-reformandpolicy-affordability.php (accessed on Feb. 28, 2020).
43. Altarum Healthcare Value Hub, Improving Value: Global Budgets, https://healthcarevaluehub.org/improving-value/browse-strategy/global-budgets (accessed on Feb. 28, 2020).
44. Bartlett, Jessica, “Mass. Kept Health Care Cost Growth to 3.1% in 2018,” Boston Business Journal (Oct. 8, 2019).
45. Hunt, Amanda, Six Categories of Healthcare Waste: Which Reign Supreme?, Altarum Healthcare Value Hub, Washington, D.C. (October 2019).

HEALTHCARE VALUE HUB
The Healthcare Value Hub can help you find free, timely information about policies and practices to achieve health systems that are equitable, affordable, and focused on the goals and needs of the people the system is meant to serve.
Share
![]()
![]()
![]()

Follow
![]()
![]()


![]()