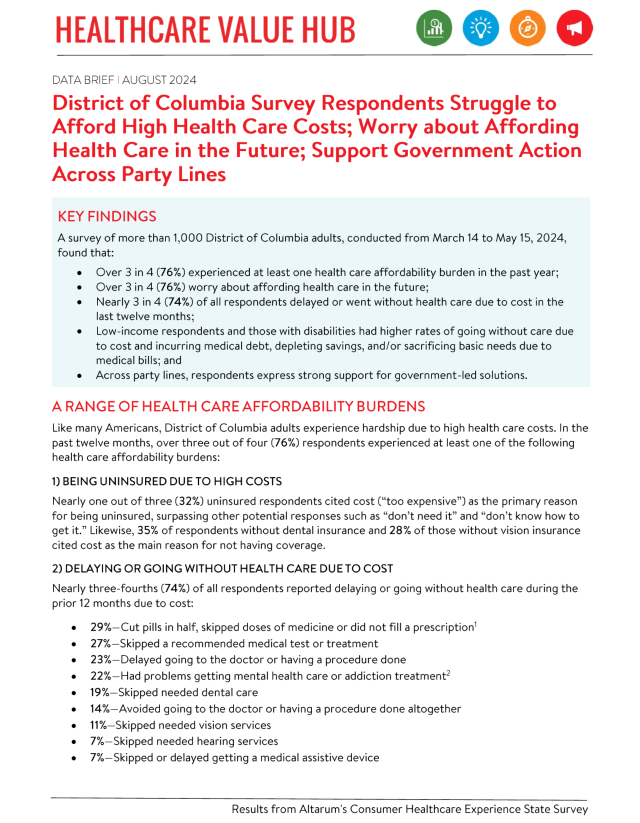
District of Columbia Survey Respondents Struggle to Afford High Health Care Costs; Worry about Affording Health Care in the Future; Support Government Action Across Party Lines
Key Findings
A survey of more than 1,000 District of Columbia adults, conducted from March 14 to May 15, 2024,
found that:
- Over 3 in 4 (76%) experienced at least one health care affordability burden in the past year;
- Over 3 in 4 (76%) worry about affording health care in the future;
- Nearly 3 in 4 (74%) of all respondents delayed or went without health care due to cost in the last twelve months;
- Low-income respondents and those with disabilities had higher rates of going without care due to cost and incurring medical debt, depleting savings, and/or sacrificing basic needs due to medical bills; and
- Across party lines, respondents express strong support for government-led solutions.
A Range of Health Care Affordability Burdens
Like many Americans, District of Columbia adults experience hardship due to high health care costs. In the past twelve months, over three out of four (76%) respondents experienced at least one of the following health care affordability burdens:
1) Being Uninsured Due to High Costs
Nearly one out of three (32%) uninsured respondents cited cost ("too expensive") as the primary reason
for being uninsured, surpassing other potential responses such as "don't need it" and "don't know how to
get it." Likewise, 35% of respondents without dental insurance and 28% of those without vision insurance
cited cost as the main reason for not having coverage.
2) Delaying or Going Without Health Care Due to Cost
Nearly three-fourths (74%) of all respondents reported delaying or going without health care during the
prior 12 months due to cost:
- 29%—Cut pills in half, skipped doses of medicine or did not fill a prescription1
- 27%—Skipped a recommended medical test or treatment
- 23%—Delayed going to the doctor or having a procedure done
- 22%—Had problems getting mental health care or addiction treatment2
- 19%-Skipped needed dental care
- 14%—Avoided going to the doctor or having a procedure done altogether
- 11%—Skipped needed vision services
- 7%-Skipped needed hearing services
- 7%—Skipped or delayed getting a medical assistive device
Respondents most frequently cited not being able to get an appointment (24%), followed by cost (21%) as
the reason for them or their family members not getting care in the last year exceeding a host of other
barriers like getting time off work, transportation, and lack of childcare.
3) Struggling to Pay Medical Bills
Other times, respondents got the care they needed but experienced a cost burden due to the resulting
medical bill(s). Nearly half (46%) of respondents reported experiencing one or more of these struggles to
pay their medical bills:
- 18%—Were unable to pay for basic necessities like food, heat or housing
- 18%—Used up all or most of their savings
- 14%—Borrowed money, got a loan or another mortgage on their home
- 12%—Were contacted by a collection agency
- 9%—Racked up large amounts of credit card debt
- 8%—Were placed on a long-term payment plan
- 8% - Asked for donations (GoFundMe campaigns)
High Levels of Worry About Affording Health Care in the Future
District of Columbia respondents also exhibit high levels of worry about affording health care in the
future. Over three in four (76%) reported being "worried" or "very worried" about affording some aspect
of health care in the future, including:
- 58%—Health insurance will become unaffordable
- 57%—Medical costs when elderly
- 55% —Cost of nursing home or home care services
- 54%—Medical costs in the event of a serious illness or accident
- 47%—Prescription drugs will become unaffordable
- 45%—Cost of dental care
- 42%—Cost of needed vision services
- 41%—Cost of needed hearing services
While two of the most common worries—affording the cost of nursing home or home care services and
medical costs when elderly—are applicable predominantly to an older population, they were most
frequently reported by younger respondents. Respondents aged 35-54 reported the highest worry about
medical costs in old age, and those aged 35-54 were most concerned about affording nursing home or
home care costs. This suggests that District of Columbia respondents may be worried about affording the
cost of care for both aging relatives and themselves.
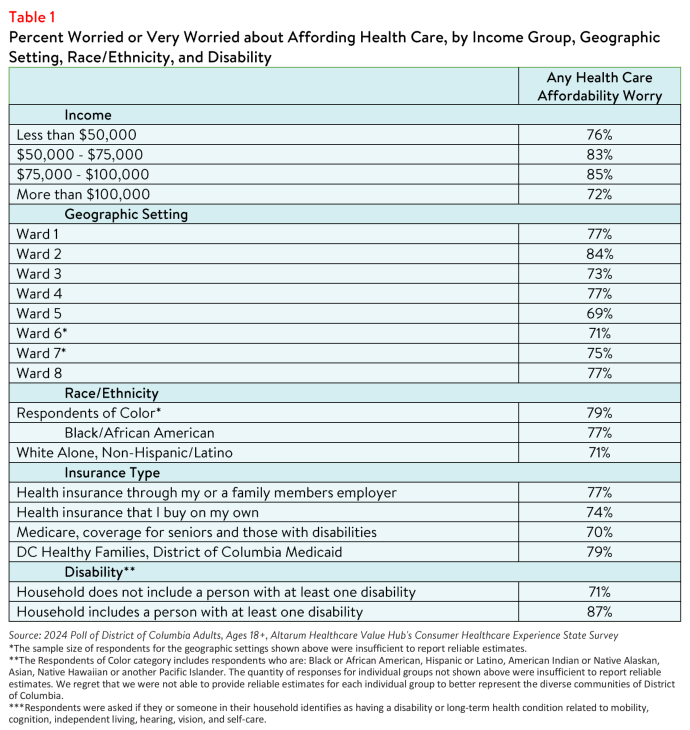
Likewise, worry about affording health care was highest among respondents living in lower to middleincome households, those with a disabled household member, and those in the Ward 2 area (see Table 1). Overall, 85% of respondents with an annual household income between $75,000 and $100,000 reported worrying about affording some aspect of coverage or care in the past year. However, 72% of those earning over $100,000 per year also reported concerns.3 In fact, concerns were consistent across all respondent income levels, education levels, races, ethnicities, geographic settings, and abilities.
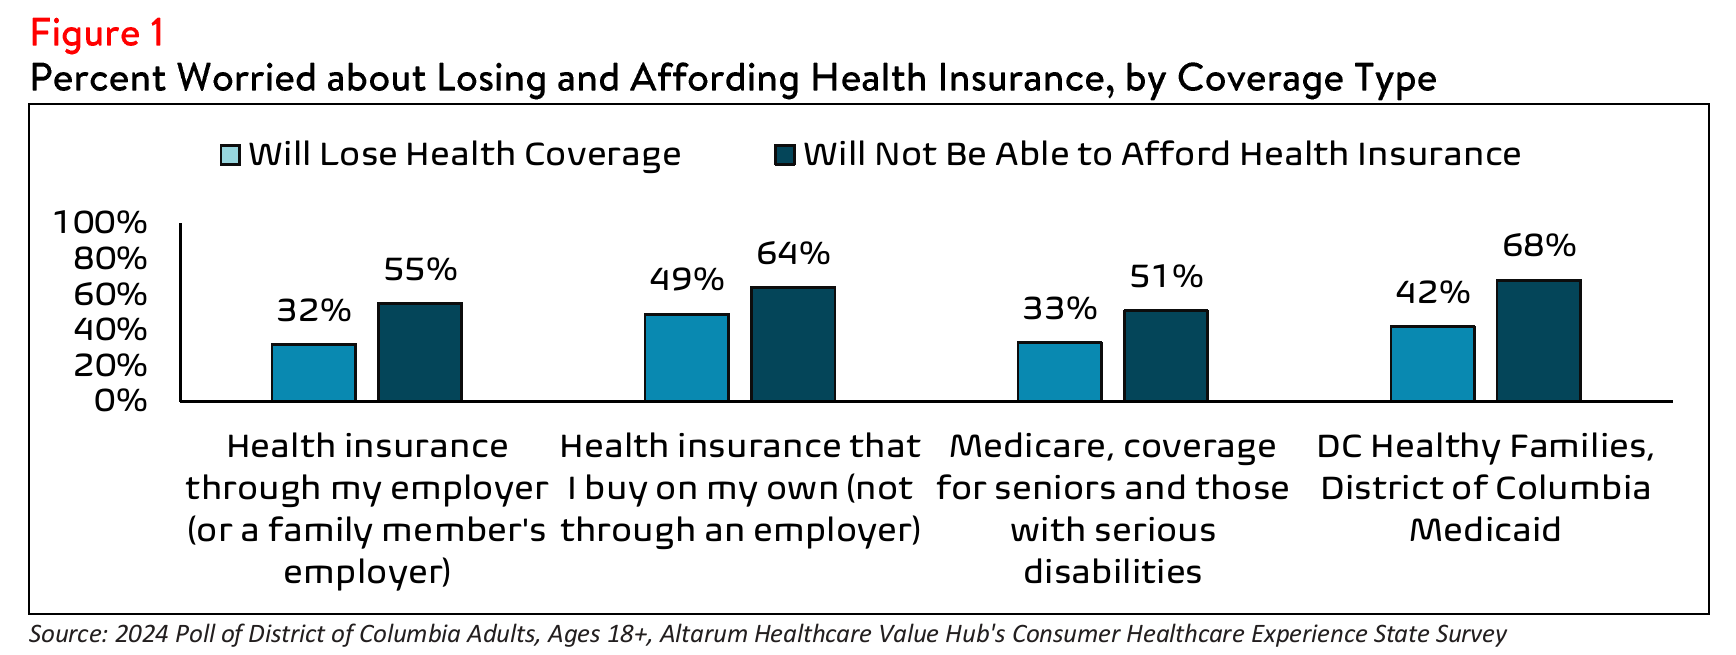
Respondents with Medicaid most frequently reported being worried about affording health care, followed
closely by respondents with individual health insurance, such as coverage purchased through an employer (see Figure 1). Although DC Healthy Families, the state Medicaid program, offers coverage for a variety of physical, dental and behavioral health services, this data point may indicate that Medicaid enrollees have faced financial barriers to receiving services not covered by the plan.
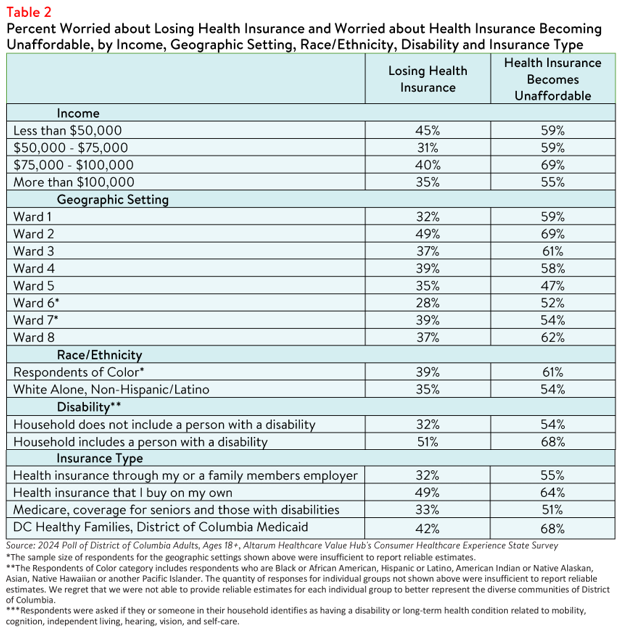
Concern that health insurance will become unaffordable is also more prevalent among certain groups.
Respondents with an annual household income between $75,000 and $100,000 reported the highest
rates of concern that health insurance will become too expensive, followed by respondents with an annual
household income less than $75,000. Likewise, respondents living in Ward 2 and respondents living in a household that includes a person with a disability also reported the highest rates of concern that health
insurance will become unaffordable (see Table 2).
Although concerns about affording coverage surpassed fears about losing coverage across all income levels, regions, races, ethnicities and coverage types, the data indicates that certain respondents are more concerned about losing coverage than others. For example, those with an annual household income below $50,000 reported the highest concern about losing coverage, as well as households with a person with a disability, and respondents living in the Ward 2 area (see Table 2).
Differences in Health Care Affordability Burdens
The survey also revealed differences in how District of Columbia respondents experience health care
affordability burdens by income, age, geographic setting, disability, race and ethnicity.
Income and Age
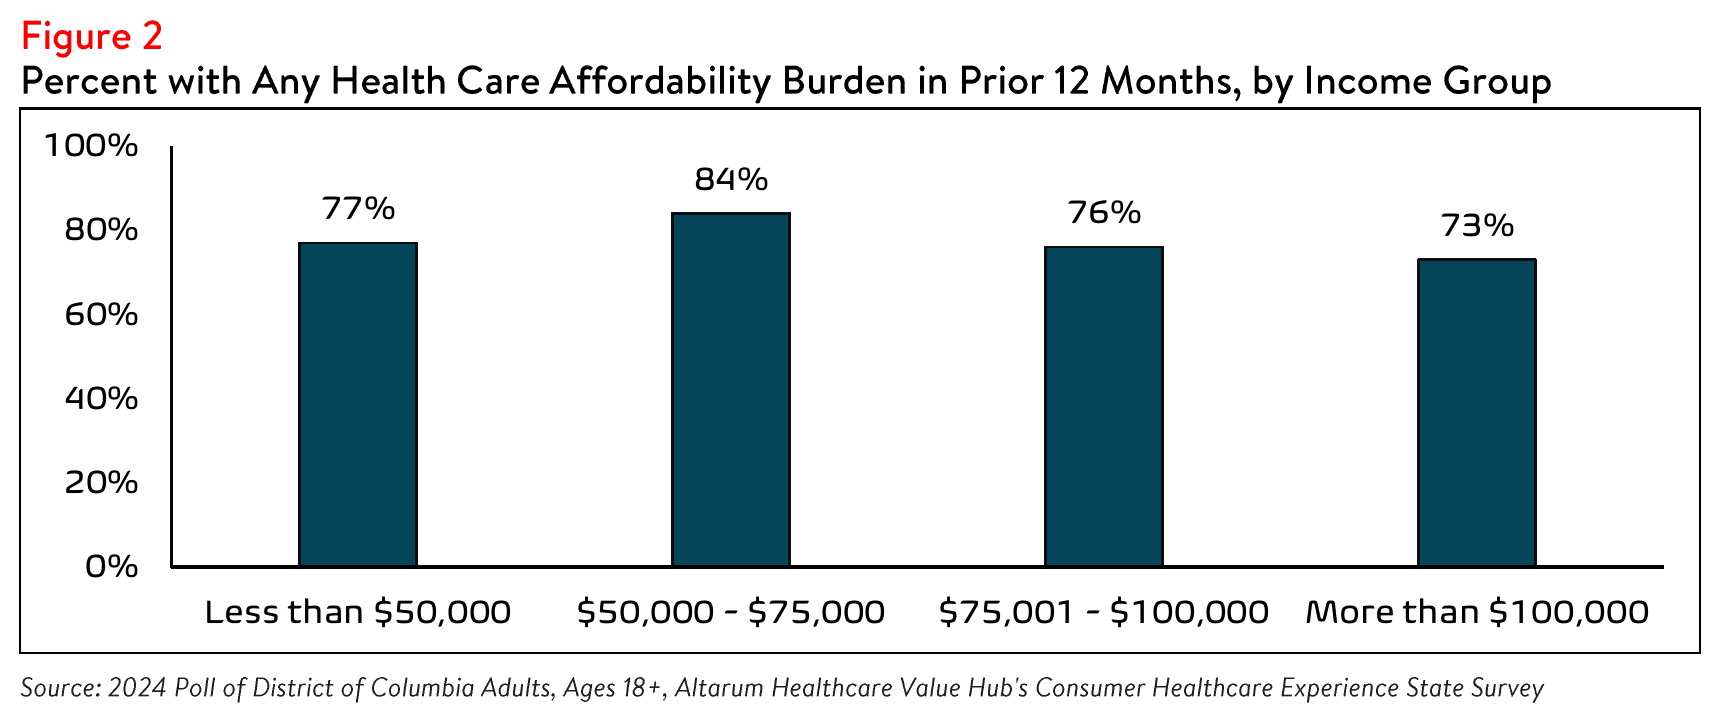
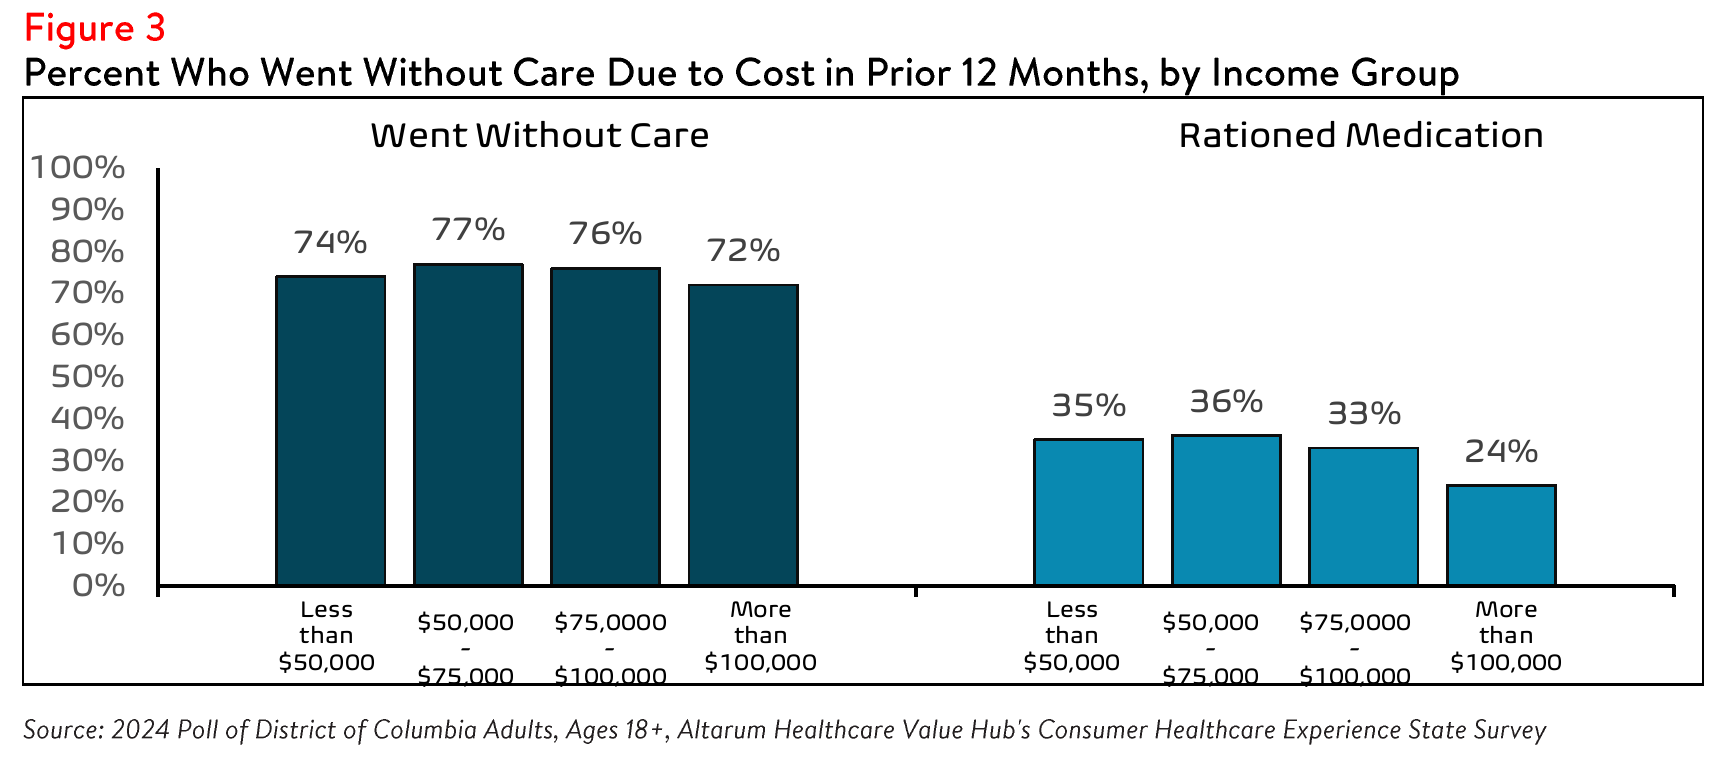
Respondents at the lowest end of the income spectrum most frequently reported experiencing one or more health care affordability burdens. Greater than four out of five (84%) respondents earning less than
$75,000 per year reported struggling to afford some aspect of coverage or care in the past 12 months (see Figure 2). This may be related, in part, to respondents in this income group reporting higher rates of going without care and rationing their medication due to cost (see Figure 3).
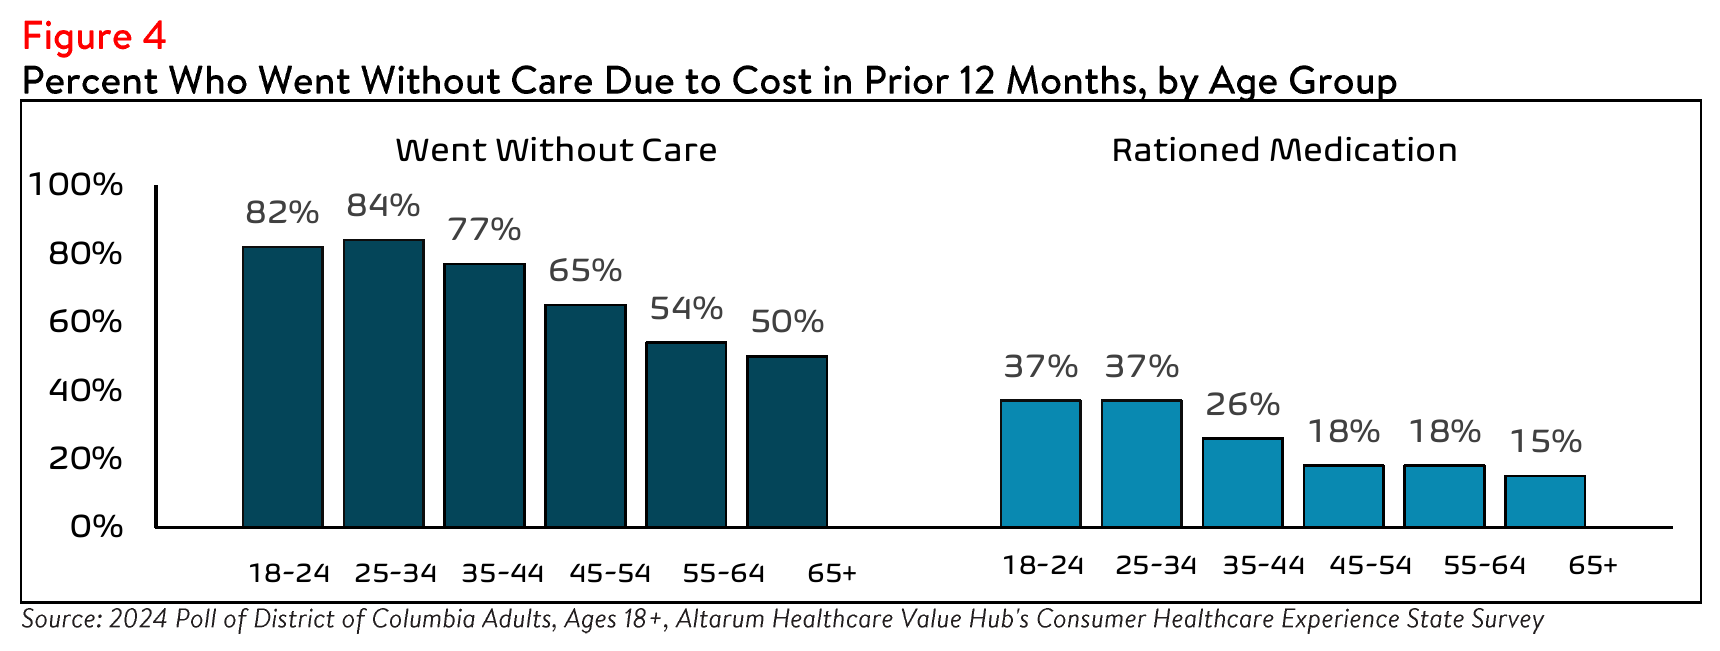
Further analysis found that District of Columbia respondents aged 18-44 reported the highest rates of
forgoing care due to cost. However, more than half of respondents aged 18-64 reported going without
care due to financial barriers, signaling that the issue extends across age groups. Likewise, respondents
aged 18-44 most frequently reported rationing medication due to cost compared to other age groups
(see Figure 4).
Disability
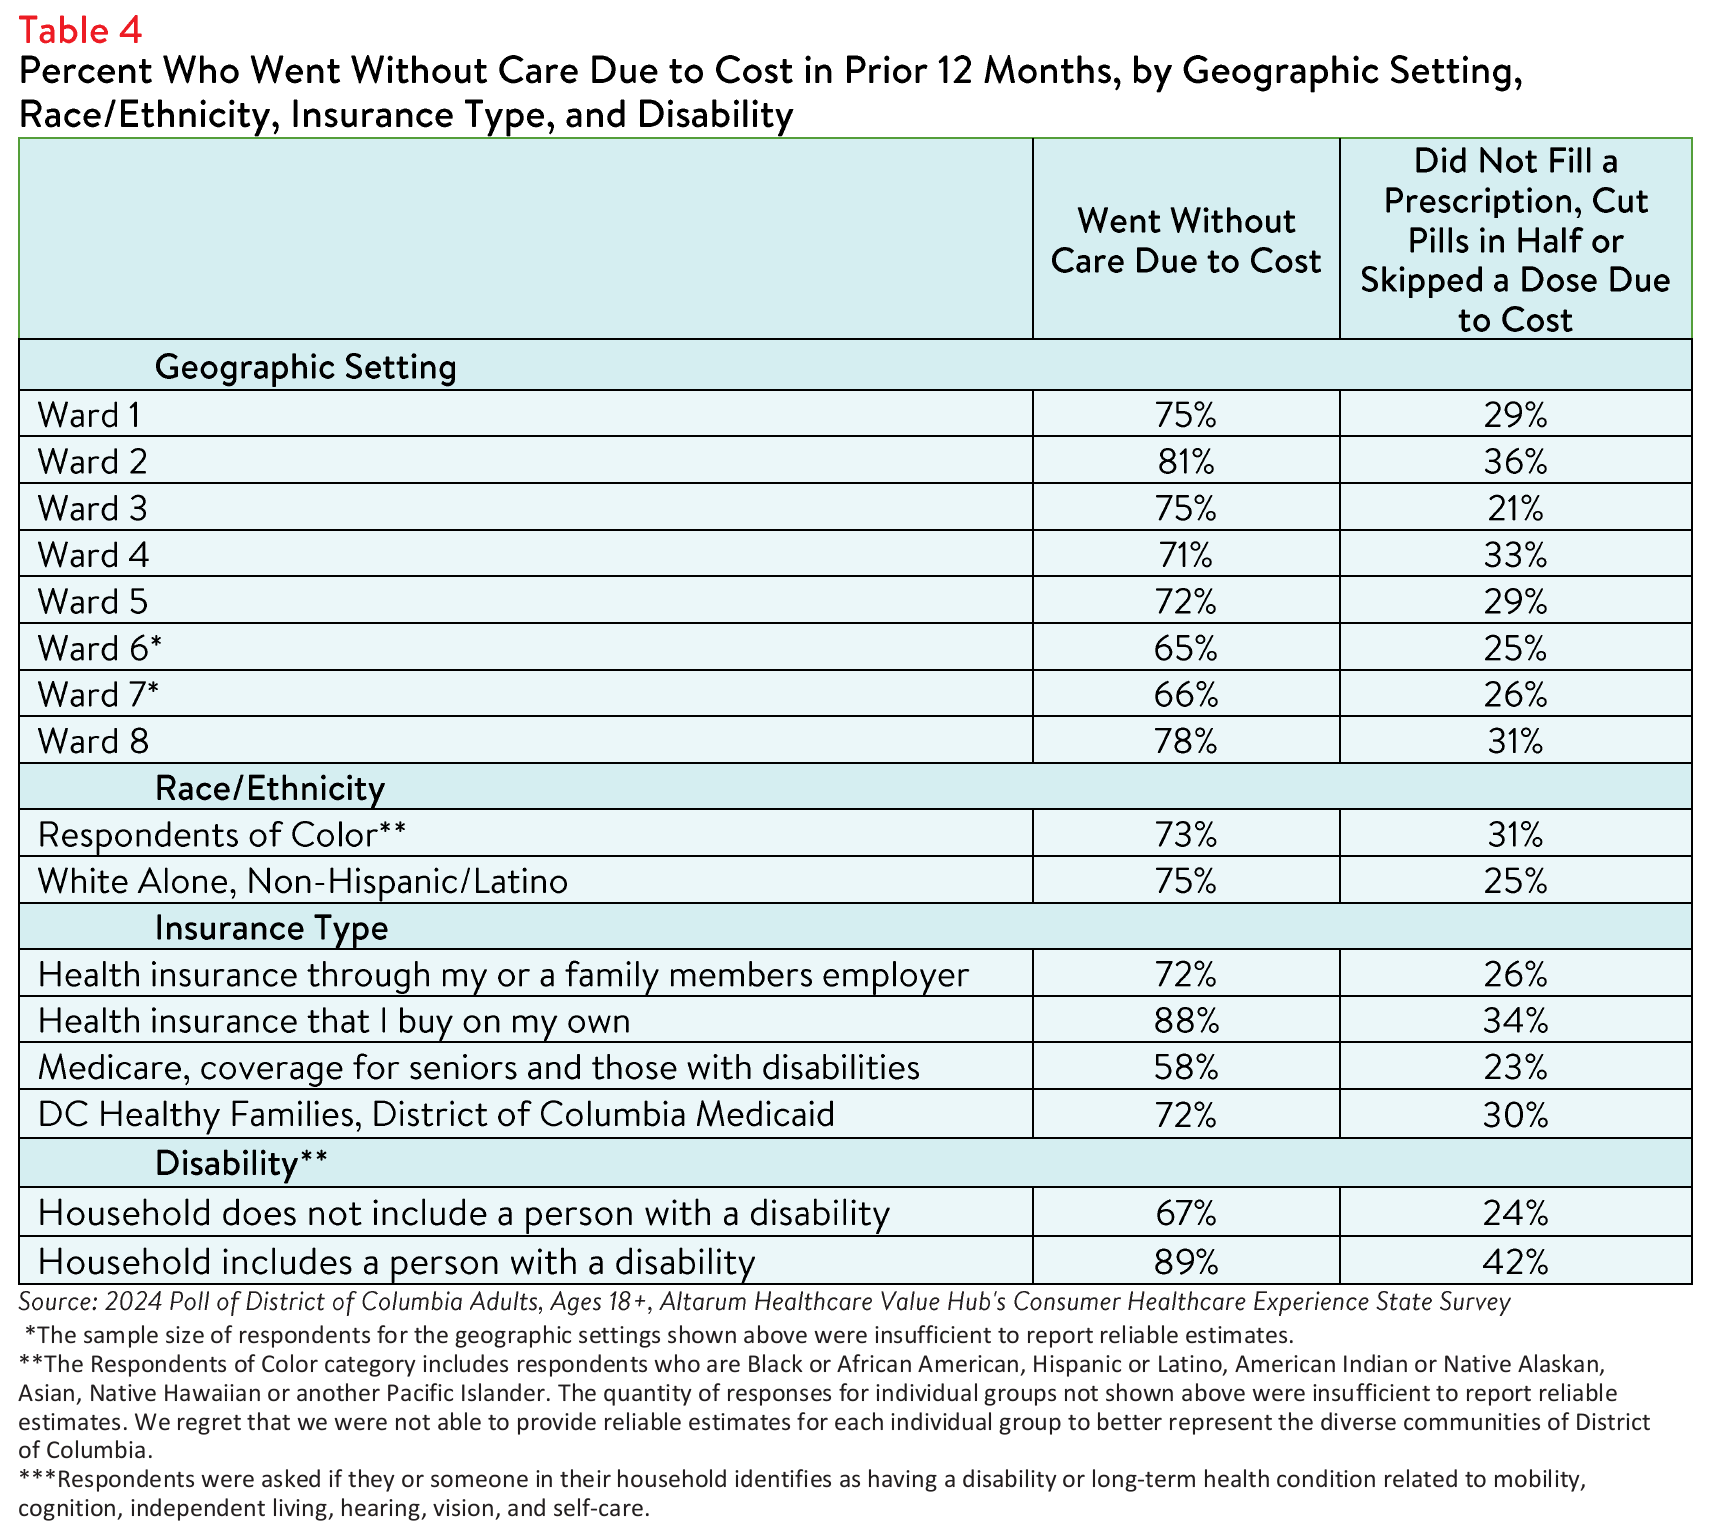
Respondents living in households with a person with a disability reported the highest rates forgoing care
and rationing medication due to cost. Of those included in this group, 89% reported going without some
form of care and 42% reported rationing medication due to cost in the past year. In contrast, fewer
respondents living in a household without a person with a disability reported forgoing care (67%) and
rationing medication (24%) due to cost (see Table 4).
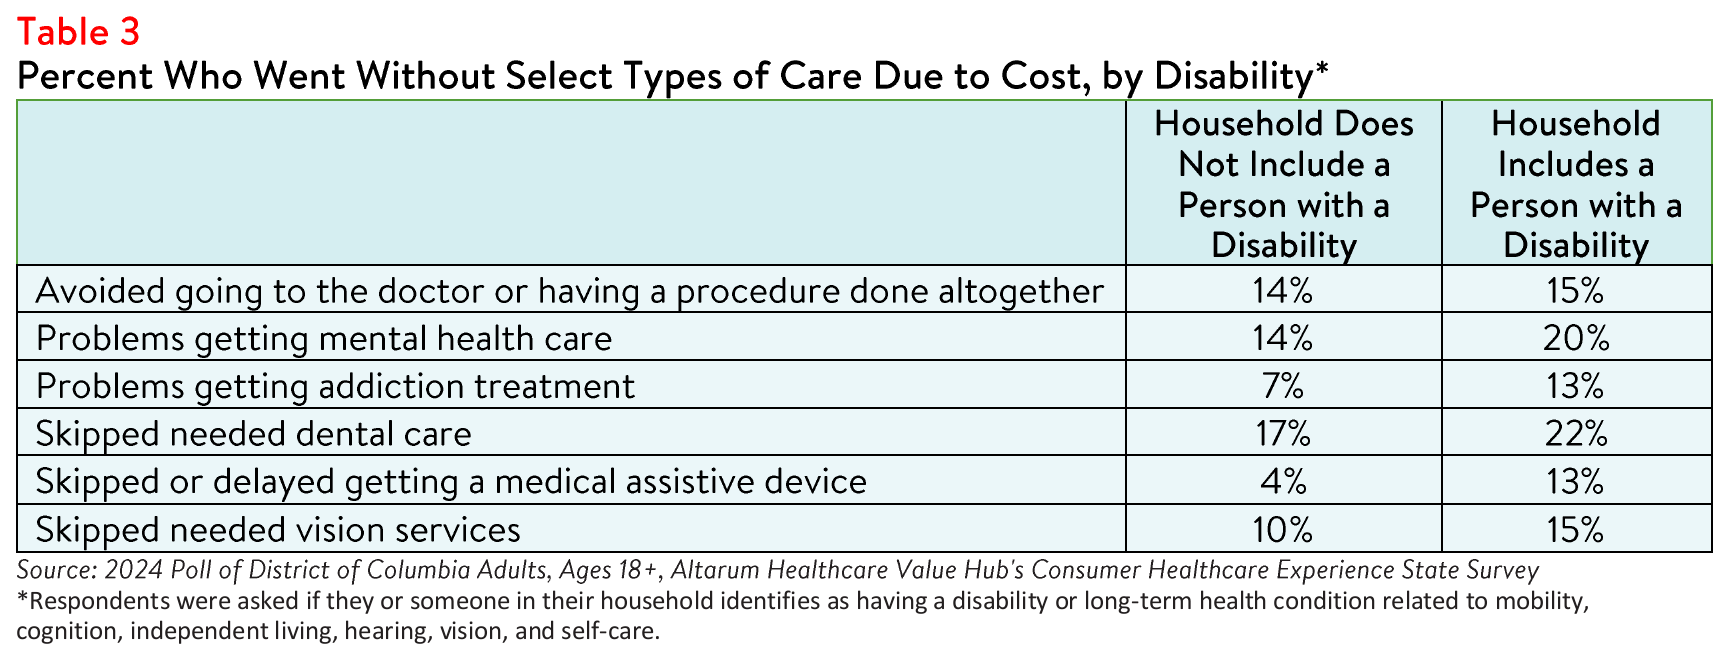
Additionally, respondents living in households with a person with a disability more frequently reported
skipping necessary mental health, addiction treatment, vision and dental care services due to cost
compared to respondents living in households without a person with a disability (see Table 3).
Those with disabilities also face health care affordability burdens unique to their disabilities— 13% of
respondents with a disabled household member reported delaying getting a medical assistive device such as a wheelchair, cane/walker, hearing aid, or prosthetic limb due to cost. Only 4% of respondents in
households without a disabled person reported this experience.
Insurance Type
People with different types of insurance navigate the health care system in varying ways. Those with
private insurance may face higher premiums and out-of-pocket costs, while individuals enrolled in
Medicaid or Medicare generally have lower costs but may encounter limited provider options, greater
restrictions around covered services, and longer wait times for services.
In District of Columbia, respondents who purchased insurance independently reported the highest rates
of going without care due to cost and rationing medication, followed by respondents with private
insurance purchased independently (see Table 4). Still, nearly three out of four (72%) of respondents with
Medicaid coverage also went without care due to cost in the twelve months prior to taking the survey.
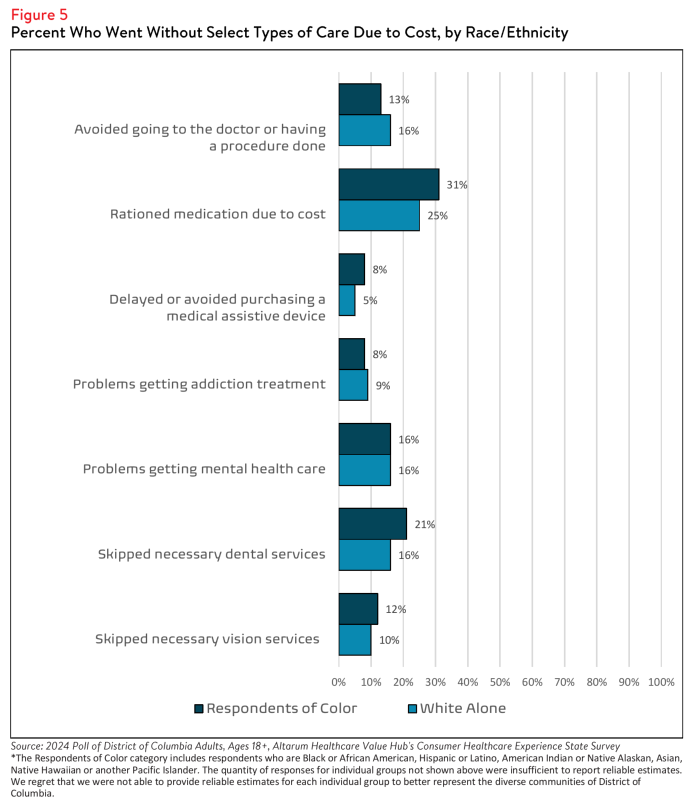
Race and Ethnicity
White alone, non-Hispanic/Latino respondents reported going without care due to cost more frequently
than respondents of color. However, these respondents reported lower rates of rationing medication due
to financial concerns compared to respondents of color. There are a variety of potential consequences
related to postponing health care and medication rationing, highlighting the importance of addressing
cost-related barriers to address health disparities.
In the District of Columbia, seventy-five percent (75%) of white alone, non-Hispanic/Latino respondents
reported going without care due to cost in the past twelve months compared to 73% of respondents of
color (see Table 4). Further analysis showed that respondents of color reported higher rates of skipping
dental services, vision services, and purchasing a medical assistive device (see Figure 5).
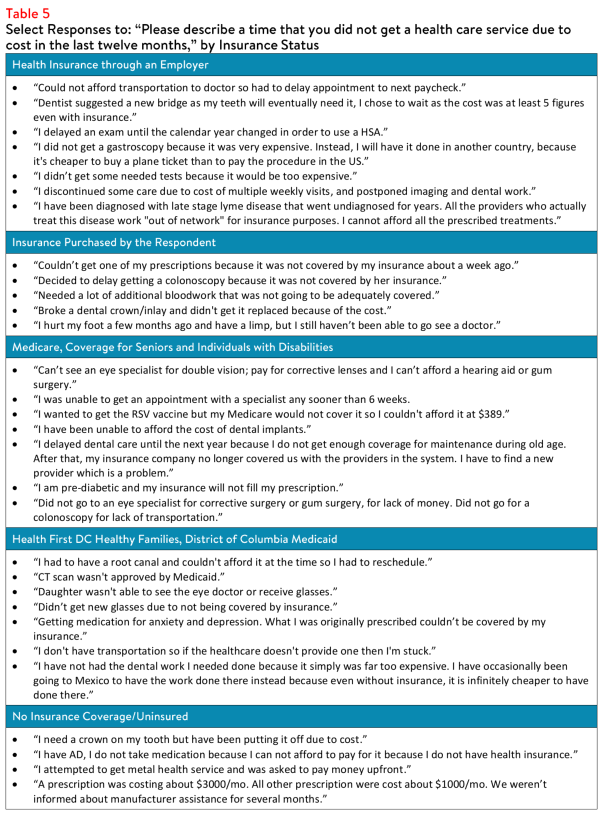
In an effort to explore the impact high health costs have on individuals, respondents were also asked to
describe a time that they were unable to get health care due to cost (see Table 5). These anecdotes
highlight affordability challenges, underscore the impact of health care costs on individuals, and
emphasize the need for solutions to reduce financial barriers to care.
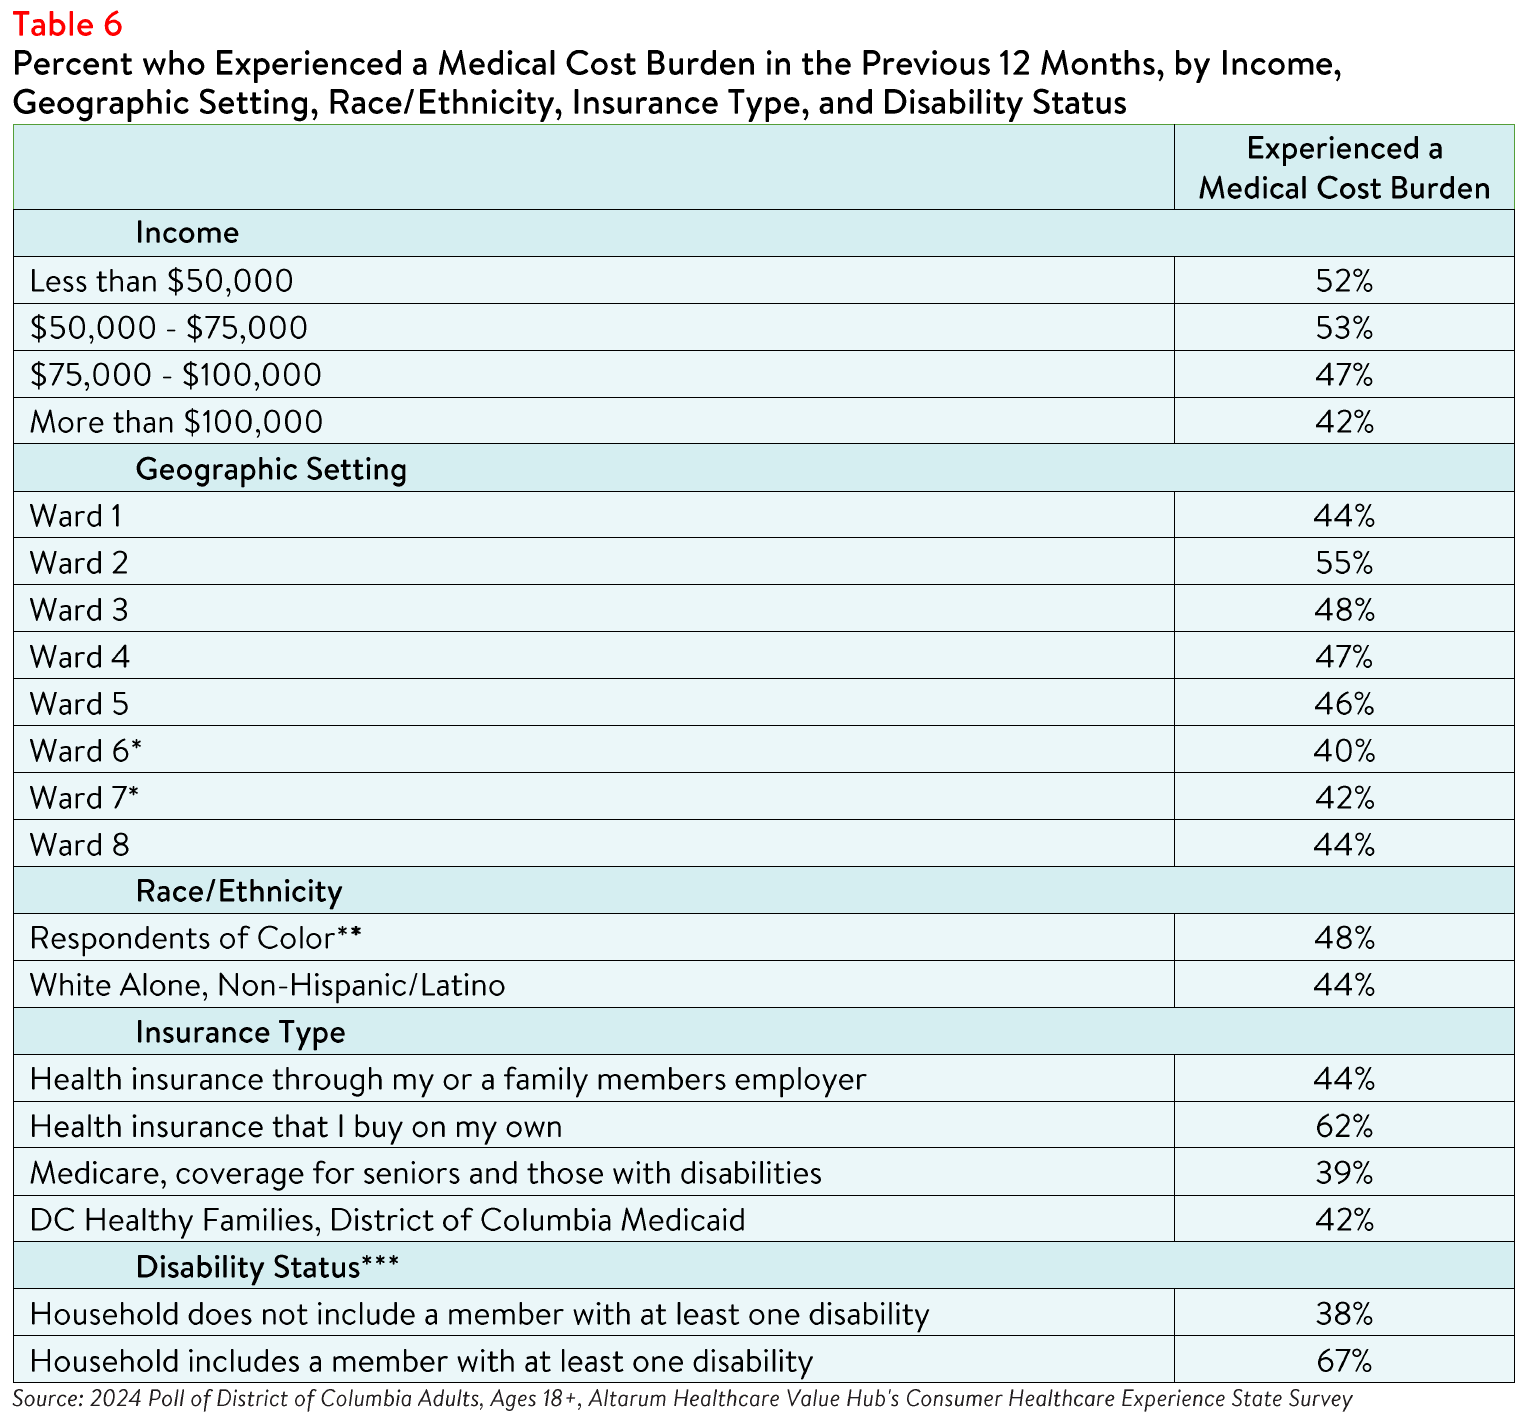
Encountering Medical Debt
In the absence of affordable care options, individuals may find themselves burdened by medical costs. To
explore the impact of unaffordable medical care, survey participants were asked whether they have had to
do any of the following due to the cost of medical bills in the past twelve months: use up all or most of
their savings; sacrifice basic necessities, such as food, heat, or housing; borrow money, get a loan or take
out another mortgage; use a crowdfunding platform to solicit donations; interact with a collections
agency; go into credit card debt; be placed on a long-term payment plan; or declare bankruptcy.
The survey results revealed that respondents of color reported enduring at least one of the previous
experiences more frequently than white respondents. Likewise, respondents who have or live with a
person with a disability also reported navigating medical cost burdens more frequently than respondents
without a disabled household member, and respondents with health insurance purchased on their own
reported the highest rates of the above burdens due to medical bills (62%) compared to respondents with
all other insurance types (see Table 6).
Impact of and Worry Related to Hospital Consolidation
In the past year, 35% of respondents reported that they were aware of a merger or acquisition in their
community—of those respondents, 41% reported that they or a family member were unable to access
their preferred health care organization because of a merger that made their preferred organization outof-
network. Out of those who reported being unable to access their preferred healthcare provider due to
a merger:
- 62% delayed or avoided going to the doctor or having a procedure done because they could no longer access their preferred health care organization due to a merger,
- 31% skipped filling a prescription medication,
- 28% skipped recommended follow-up visits due to a merger,
- 17% changed their preferred doctor or hospital to one that is in-network, and
- 10% had to change their preferred provider due to a merger resulting in a service closure.
Out of those who reported that the merger caused an additional burden for them or their families, the top
three most frequently reported issues were:
- 38% — The merger created an added wait time when searching for a new provider
- 23% — The merger created an added financial burden
- 18% — The merger created a gap in the continuity of my care
While a smaller portion of respondents reported being unable to access their preferred health care
organization because of a merger, far more respondents (66%) reported being somewhat, moderately, or
very worried about the impacts of mergers in their health care organizations. When asked about their
largest concern respondents most frequently reported:
- 27%— I'm concerned I will have fewer choices of where to receive care
- 24%— I'm concerned I will have to pay more to see my doctor
- 22%— I'm concerned my doctor may no longer be covered by my insurance
- 14%— I'm concerned I will have to travel farther to see my doctor
- 13%— I'm concerned I will have a lower quality of care
Dissatisfaction with the Health System and Support for Change
In light of District of Columbia respondents' health care affordability burdens and concerns, it is not
surprising that they are dissatisfied with the health system. Of the respondents surveyed:
- Just 40% agreed or strongly agreed that "we have a great healthcare system in the U.S.,"
- While 73% agreed or strongly agreed that "the system needs to change."
To investigate further, the survey asked respondents to share their perspectives on both personal and
governmental actions to address the high health costs.
Personal Actions
District of Columbia respondents see a role for themselves in addressing health care affordability. When
asked about specific actions they could take:
- 60% of respondents reported researching the cost of a drug beforehand, and
- 53% said they would be willing to switch from a brand name to an equivalent generic drug if given the chance.
When asked to select the top three personal actions they felt would be most effective in
addressing health care affordability (out of ten options), the most common responses were:
- 70% — Take better care of my personal health
- 45% — Research treatments myself before going to the doctor
- 34% — Do more to compare provider cost and quality before getting services
- 21% — Contact my state representatives asking them to address high healthcare prices and lack of affordable coverage options
- 20% — Contact my federal representatives asking them to address high healthcare prices and lack of affordable coverage options
- 14% — There is not anything I can do personally to change to make our health system work better.
Government Actions
District of Columbia respondents see government as the key stakeholder that needs to act to address
health system problems. Moreover, addressing health care problems is one of the top priorities that
respondents want their elected officials to work on. At the beginning of the survey, respondents were
asked what issues the government should address in the upcoming year. Respondents most frequently
chose:
- 44%— Health care
- 39%— Affordable Housing
- 38%— Economy/Joblessness
When asked about the top three health care priorities the government should address, respondents most
frequently chose:
- 37%— Address high health care costs, including prescription drugs
- 31%— Get health insurance to those who cannot afford coverage
- 28%— Improve Medicare, coverage for seniors and those with serious disabilities
- 27%— Preserve consumer protections preventing people from being denied coverage or charged more for having a pre-existing medical condition
Out of fifteen possible options, District of Columbia respondents most frequently reported believing that
the reason for high health care costs is unfair prices charged by powerful industry stakeholders, such as:
- 63% — Drug companies charging too much money
- 61% — Insurance companies charging too much money
- 61% — Hospitals charging too much money
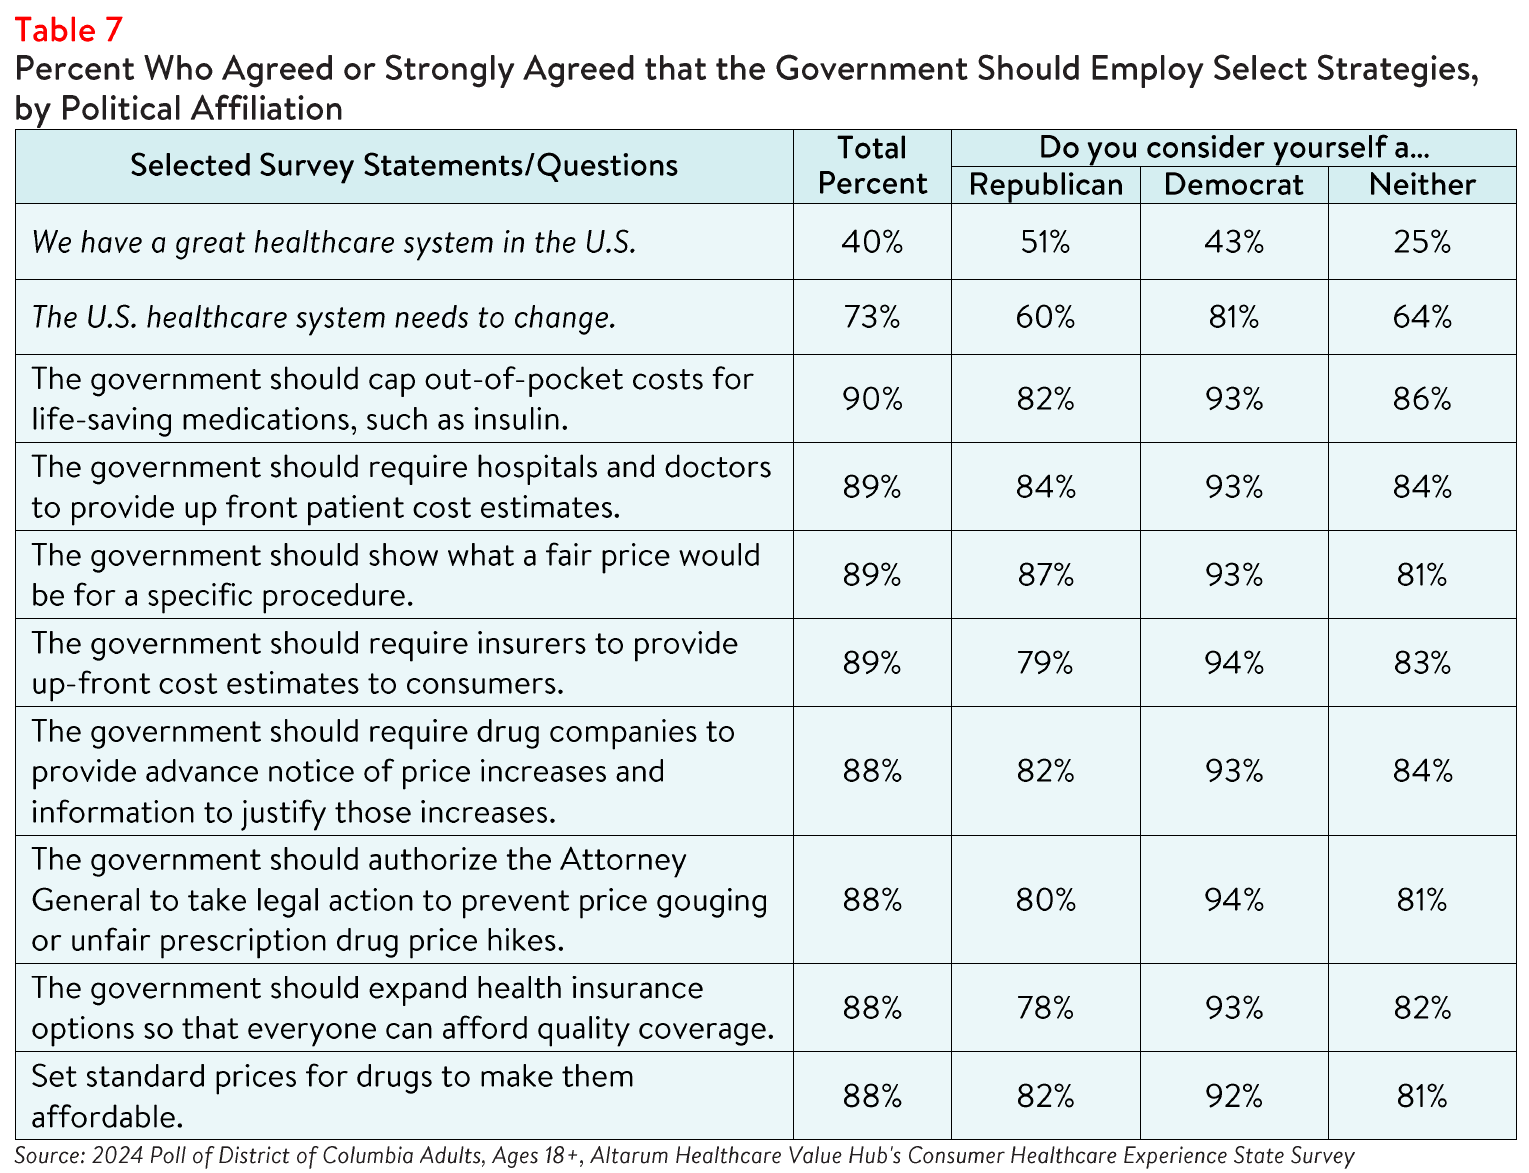
When it comes to tackling costs, respondents endorsed a number of strategies, including:
- 90% — Cap out-of-pocket costs for life-saving medications, such as insulin
- 89% — Require hospitals and doctors to provide up-front cost estimates to consumers
- 89% — Show what a fair price would be for specific procedures
- 89% — Require insurers to provide up-front cost estimates to consumers
- 88% — Require drug companies to provide advanced written notice of price increases and information to justify those increases
- 88% — Authorize the Attorney General to take legal action to prevent price gouging or unfair prescription drug price hikes
- 88% — Expand health insurance options so that everyone can afford quality coverage
- 88% —Set standard prices for drugs to make them affordable
Support for Action Across Party Lines
There is remarkable support for change regardless of respondents' political affiliation (see Table 7). The
high burden of health care affordability, along with high levels of support for change, suggest that elected
leaders and other stakeholders need to make addressing this consumer burden a top priority. Annual
surveys can help assess whether progress is being made.
Notes
- Of the 74% of respondents who encountered one or more cost-related barriers to getting health care during the past twelve months, 17% did not fill a prescription and 16% cut pills in half or skipped doses of medicine due to cost.
- Eighteen percent (16%) had problems getting mental health care and 8% had problems getting addiction treatment.
- Median household income in District of Columbia is $101,722 (2018-2022). U.S. Census, Quick Facts. Retrieved from: U.S. Census Bureau QuickFacts, U.S. Census Bureau QuickFacts: District of Columbia.
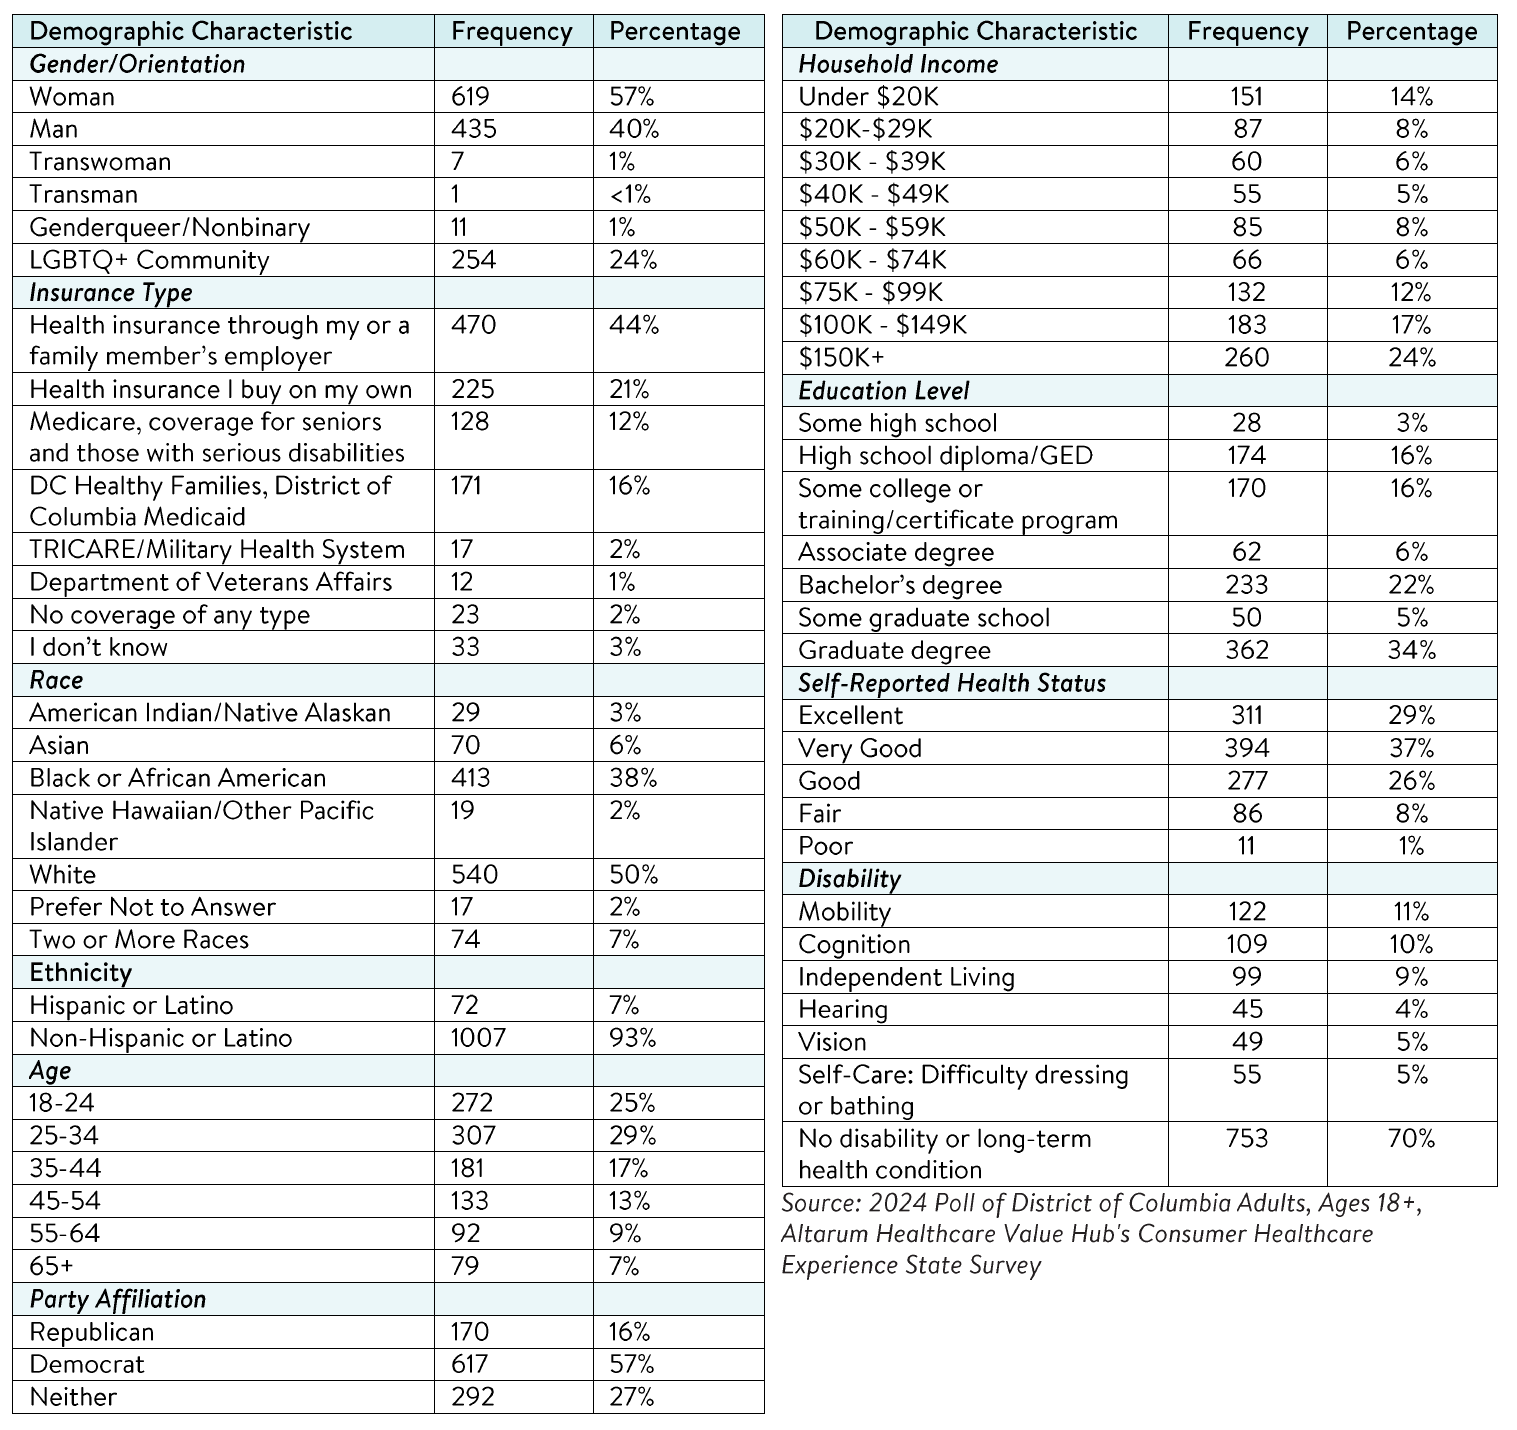
Methodology
Altarum's Consumer Healthcare Experience State Survey (CHESS) is designed to elicit respondents' views on a wide range of health system issues, including confidence using the health system, financial burden and possible policy solutions. This survey, conducted from March 14 to May15, 2024, used a web panel from Dynata with a demographically balanced sample of approximately 1,180 respondents who live in District of Columbia. Information about Dynata's recruitment and compensation methods can be found here. The survey was conducted in English or Spanish and restricted to adults ages 18 and older.
Respondents who finished the survey in less than half the median time were excluded from the final sample, leaving 1,079 cases for analysis. After those exclusions, the demographic composition of respondents was as follows, although not all demographic information has complete response rates:

District of Columbia Survey Reports
Main District of Columbia Survey Page
2024
Statewide Reports
Prescription Drug Affordability
Report Download
|
HEALTHCARE VALUE HUB
The Healthcare Value Hub can help you find free, timely information about policies and practices to achieve health systems that are equitable, affordable, and focused on the goals and needs of the people the system is meant to serve.
Share
![]()
![]()
![]()

Follow
![]()
![]()


![]()