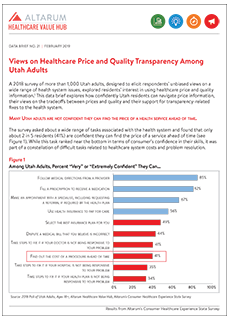
Views on Healthcare Price and Quality Transparency Among Utah Adults
A 2018 survey of more than 1,000 Utah adults, designed to elicit respondents’ unbiased views on a wide range of health system issues, explored residents’ interest in using healthcare price and quality information.1 This data brief explores how confidently Utah residents can navigate price information, their views on the tradeoffs between prices and quality and their support for transparency-related fixes to the health system.
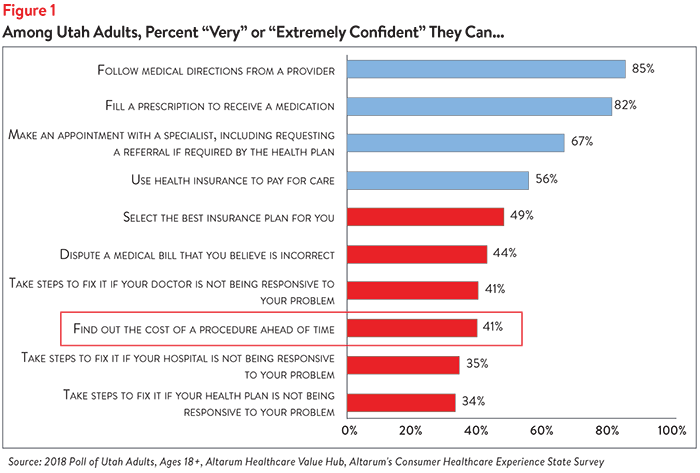
Many Utah adults are not confident they can find the price of a health service ahead of time.
The survey asked about a wide range of tasks associated with the health system and found that only about 2 in 5 residents (41%) are confident they can find the price of a service ahead of time (see Figure 1). While this task ranked near the bottom in terms of consumer’s confidence in their skills, it was part of a constellation of difficult tasks related to healthcare system costs and problem resolution.
Utah Resident’s May Not Be Able to Find the Price of Healthcare Services
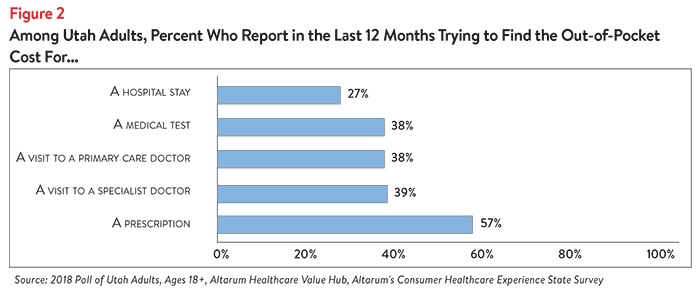
Lack of confidence finding the price of a procedure comports with the price seeking behavior reported by respondents. Relatively few residents tried to find the price of a health service in the prior 12 months (see Figure 2). The notable exception is that more than half of Utah adults tried to find out their out-of-pocket cost for a prescription medication in the last twelve months. By comparison, seeking the cost of a medical test was less frequent, and seeking the price of a hospital stay even less common.
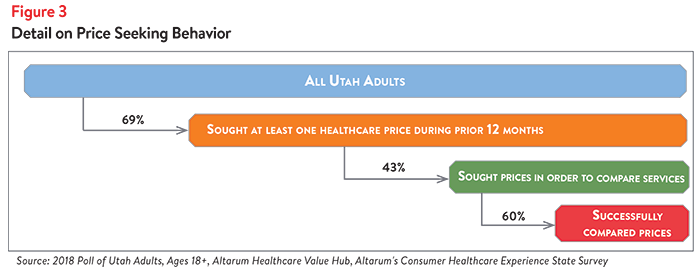
Forty-eight percent of survey respondents who sought prices only performed this activity once or twice. However, 43% of these shoppers report that they sought prices in order to compare two or more services—a rate slightly higher than previously observed in national surveys.2 Among the survey respondents who did compare two prices, 60% report that they were successful (see Figure 3).
Relationship Between Quality and Price
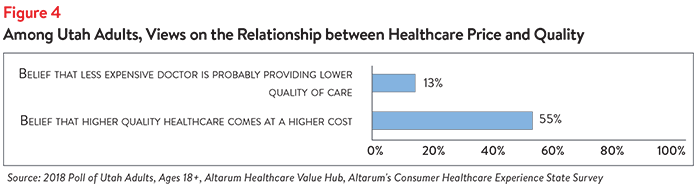
In light of well-documented, widespread variation in clinical quality and price,3 it is clear that consumers need both price and quality data if they are to successfully identify providers and treatment options that are of “good value.” Researchers have established that if we fail to provide quality data alongside price information, consumers may use high price as a proxy for high quality,4 despite the fact that studies show there is little relationship between the quality and price of a medical service.5 This survey investigated Utah respondents’ own views on the relationship between quality and price.
More than half of Utah adults (55%) believe that higher quality health care usually comes at a higher cost, yet, very few believe that prices reliably signal the quality of care. Just 13% believe that a less expensive doctor is likely providing lower-quality care (see Figure 4).
Both cost and quality are important to Utah’s healthcare consumers. Over half of Utah adults (54%) indicated that if two doctors or healthcare providers had equal quality ratings, out-of-pocket costs would be a very or extremely important factor in deciding between the two professionals. Conversely, 59% of respondents indicated that if two doctors’ out-of-pocket costs were equal, quality ratings would be a very or extremely important factor in deciding between the two professionals.
Health System Fixes
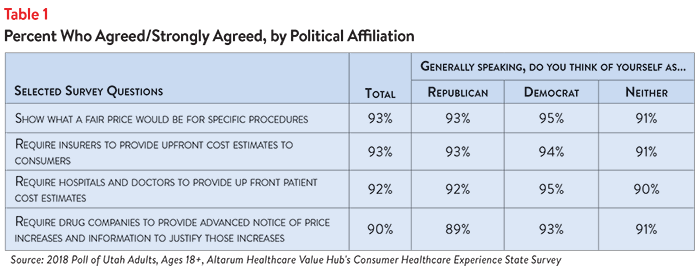
When it comes to tackling problems in the health system (affordability being the dominant concern) respondents endorsed a number of transparency-oriented strategies: 6
- 93%—Show what a fair price would be for specific procedures
- 93%—Require insurers to provide upfront cost estimates to consumers
- 92%—Require hospitals and doctors to provide up front patient cost estimates
- 90%—Require drug companies to provide advanced notice of price increases and information to justify those increases
Strikingly, respondents strongly endorsed these approaches across party lines (see Table 1).
While Utah residents are united in strongly calling for a role for government in addressing health system issues, they also see a role for themselves. Out of 10 possible personal actions they could take to address affordability in healthcare, the action of “doing more to compare cost and quality before getting services” was not perceived as effective and ranked 5th behind other personal actions:
- 62% reported that taking better care of their personal health
- 39% said write to or call my federal representative asking them to take action on high healthcare prices and lack of affordable coverage options.
- 38% said write to or call my state representative asking them to take action on high healthcare prices and lack of affordable coverage options
- 32% reported research treatments myself before going to the doctor
Discussion
Utah residents demonstrate they are knowledgeable about the lack of relationship between the cost and quality of healthcare and are willing to seek out-of-pocket cost data but only 43% of residents have tried to compare the prices of two different services. Perhaps related, residents also report lacking confidence that they can find healthcare price information and they don’t believe that price shopping is the most important activity when it comes to addressing healthcare affordability, although 31% do report a willingness to take this action. Respondents strongly endorsed a range of transparency-related and non-transparency policy fixes that they’d like their elected officials to enact.
Policymakers and other stakeholders often tout price and quality transparency as vital components of a high functioning healthcare system. Notably, opinions about the benefits and dangers of healthcare price and quality transparency are evolving rapidly. Most agree that healthcare transparency can help keep consumers safe by allowing them to judge affordability, plan for the expense of needed healthcare services and find high quality providers. It can also inform state policymakers, allowing them to identify and address unwarranted price variation.
Despite its merits, price transparency is also inappropriately credited as making healthcare markets more efficient. For myriad reasons, transparency tools have generally not been successful in incentivizing consumers to compare quality and shop for the best price.7 This failure stems from tools that don’t contain the type of actionable information that would help consumers do this and from the fact that consumers don’t view most of the healthcare they need as a shoppable commodity. There are exceptions. Researchers at RAND and HCCI have identified healthcare services that are potentially shoppable in advance.8
Increasing the effectiveness of healthcare price and quality transparency will require a nuanced understanding of its strengths and limitations with respect to each audience using the information: patients, policymakers, regulators and providers.
Notes
1. See: Utah Residents Struggle to Afford High Healthcare Costs; Support a Range of Government Solutions Across Party Lines, Healthcare Value Hub, Data Brief No.20 (February 2019). http://www.healthcarevaluehub.org/Utah-2018-state-survey/
2. Nationally, just 20 percent of Americans have tried to compare prices across multiple providers before getting care. See: Still Searching: How People Use Health Care Price Information in the United States, Public Agenda (April 6, 2017). The comparable rate for this Utah survey is 24% (those who compared prices as a percent of all adults).
3. Cooper, Zack, et al., The Price Ain’t Right? Hospital Prices and Health Spending on the Privately Insured, Health Care Pricing Project (May 2015). http://www.healthcarepricingproject.org/papers/paper-1
4. Hibbard, Judith H., et al., “An Experiment Shows That A Well-Designed Report On Costs And Quality Can Help Consumers Choose High-Value Health Care,” Health Affairs (March 2012)
5. Hussey, P., Wertheimer, S., and Mehrotra, A. “The Association Between Health Care Quality and Cost: A Systematic Review,” Annals of Internal Medicine (Jan. 1, 2013).
6. Worth noting, respondents also endorse a range of strategies beyond the transparency approaches included here. For other strategies, please see: Utah Residents Struggle to Afford High Healthcare Costs; Support a Range of Government Solutions Across Party Lines, Healthcare Value Hub, Data Brief No. 20 (February 2019).
7. Revealing the Truth about Healthcare Price Transparency, Healthcare Value Hub, Research Brief No. 27 (June 2018).
8. Frost, Amanda, David Newman and Lynn Quincy, “Health Care Consumerism: Can the Tail Wag the Dog?” Health Affairs (March 2, 2016).
Demographics
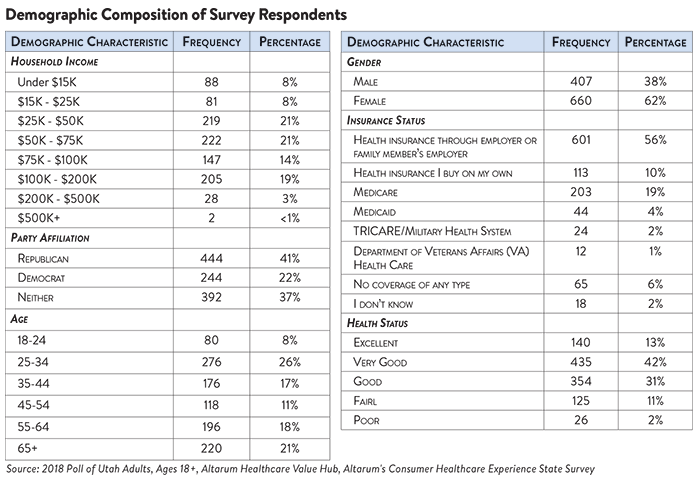
Altarum’s Consumer Healthcare Experience State Survey (CHESS) is designed to elicit respondents’ unbiased views on a wide range of health system issues, including confidence using the health system, financial burden, and views on fixes that might be needed.
The survey used a web panel from SSI Research Now with a demographically balanced sample of approximately 1,000 respondents who live in Utah. The survey was conducted only in English and restricted to adults ages 18 and older. Respondents who finished the survey in less than half the median time were excluded from the final sample, leaving 1,080 cases for analysis with weighting occurring in age, gender and income to be demographically representative of Utah. After those exclusions, the demographic composition of respondents can be found in the table below.

HEALTHCARE VALUE HUB
The Healthcare Value Hub can help you find free, timely information about policies and practices to achieve health systems that are equitable, affordable, and focused on the goals and needs of the people the system is meant to serve.
Share
![]()
![]()
![]()

Follow
![]()
![]()


![]()