Washington Residents Struggle to Afford High Healthcare Costs; Worry About Affording Healthcare in the Future; Support Government Action Across Party Lines
Key Findings
A survey of more than 1,300 Washington adults, conducted from August 3 to August 16, 2022, found that respondents are worried about affording healthcare and are looking to policymakers to address healthcare costs. Notably:
- 3 in 5 (62%) respondents experienced at least one healthcare affordability burden in the past year;
- 4 in 5 (81%) worry about affording healthcare in the future;
- Lower-income respondents, respondents with disabilities and Black/African American and Hispanic/Latinx respondents reported higher rates of going without care and incurring debt due to healthcare costs; and
- Across party lines, respondents express strong support for government-led solutions.
A Range of Healthcare Affordability Burdens
Like many Americans, Washington adults experience hardship due to high healthcare costs. All told, well over half (62%) of respondents experienced one or more of the following healthcare affordability burdens in the prior 12 months:
1) Being Uninsured Due to High Costs
Overall, 43% of uninsured respondents cited “too expensive” as the major reason for not having coverage, far exceeding other reasons like “don’t need it” and “don’t know how to get it.”
2) Delaying or Going Without Healthcare Due to Cost
More than half (56%) of all respondents reported delaying or going without a variety of healthcare services during the prior 12 months due to cost:
- 36%—Skipped needed dental care
- 33%—Delayed going to the doctor or having a procedure done
- 29%—Avoided going to the doctor or having a procedure done altogether
- 27%—Cut pills in half, skipped doses of medicine or did not fill a prescription1
- 27%—Skipped a recommended medical test or treatment
- 25%—Had problems getting mental healthcare or addiction treatment
- 16%—Skipped or delayed getting a medical assistive device
Moreover, cost was the most frequently cited reason for not getting needed medical care (reported by 24% of respondents), exceeding a host of other barriers like difficulty getting an appointment, transportation and lack of childcare.
3) Struggling to Pay Medical Bills
Other times, respondents got the care they needed but struggled to pay the resulting bill. Nearly two in five (39%) experienced one or more of these struggles to pay their medical bills:
- 19%—Used up all or most of their savings
- 14%—Were contacted by a collection agency
- 13%—Were unable to pay for basic necessities like food, heat or housing
- 12%—Racked up large amounts of credit card debt
- 12%—Borrowed money, got a loan or another mortgage on their home
- 8%—Were placed on a long-term payment plan
Of the various types of medical bills, the ones most frequently associated with an affordability barrier were doctor bills, dental bills and prescription drugs. The high prevalence of affordability burdens for these services likely reflects the frequency with which Washington respondents seek these services. Trouble paying for dental bills may reflect lower rates of coverage for these services.
High Levels of Worry About Affording Healthcare in the Future
Washington respondents also exhibit high levels of worry about affording healthcare in the future. Four in five (81%) reported being “worried” or “very worried” about affording some aspect of healthcare in the future, including:
- 64%—Cost of nursing home or home care services
- 62%—Medical costs when elderly
- 60%—Health insurance will become unaffordable
- 58%—Medical costs in the event of a serious illness or accident
- 53%—Cost of dental care
- 50%—Prescription drugs will become unaffordable
- 34%—Cost of treatment for coronavirus/COVID-19
While two of the most common worries—affording the cost of nursing home or home care services and medical costs when elderly—are applicable predominantly to an older population, they were most frequently reported by respondents ages 35-64. This finding suggests that Washington respondents may be worried about affording the cost of care for both aging parents and themselves.
Worry about affording healthcare, generally, was highest among respondents living in low- and middle-income households; respondents who are American Indian or Native Alaskan, Asian or Native Hawaiian or other Pacific Islander; Hispanic/Latinx respondents; and those living in households with a person with a disability (see Table 1).
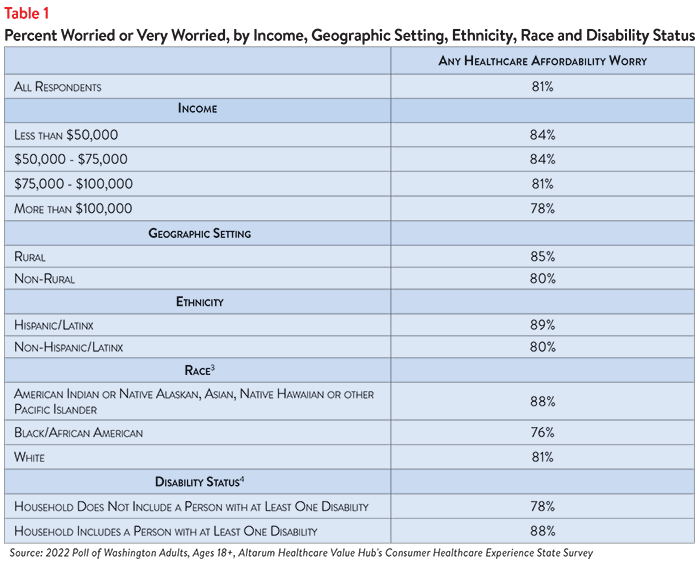
More than 4 in 5 (84%) of respondents with household incomes of less than $75,000 per year2 reported worrying about affording some aspect of coverage or care in the past year. Still, the vast majority of Washington respondents of all incomes, races, ethnicities and levels of ability statewide are somewhat or very concerned about the cost of healthcare.
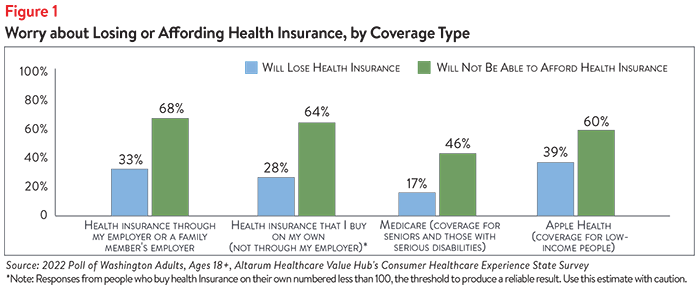
Concern that health insurance will become unaffordable is also more prevalent among certain groups of Washington adults. By insurance type, respondents with coverage through their employer are most frequently reported worrying about affording coverage, followed by respondents who buy their insurance on their own and those with Apple Health (see Figure 1).
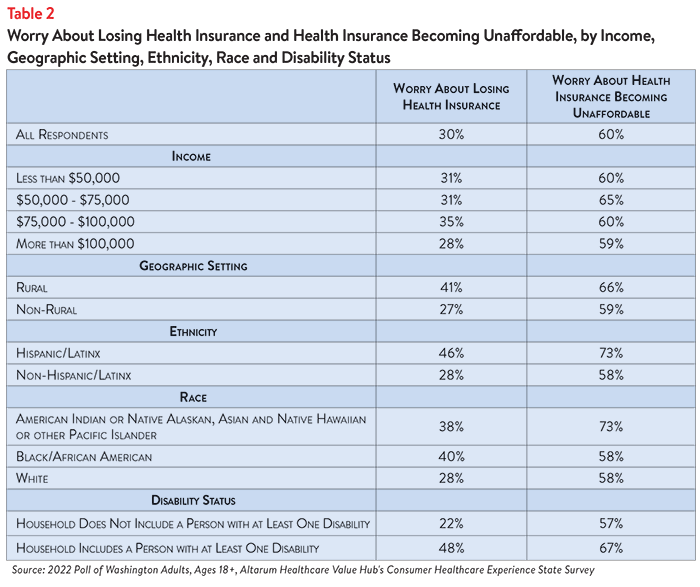
Respondents with household incomes between $50,000 and $75,000 reported the highest rates of worry about affording coverage. Black/African American respondents reported the highest rates of worry about losing coverage, while respondents in the American Indian or Native Alaskan, Asian and Native Hawaiian or other Pacific Islander group reported the highest rates of worry about affording coverage. Additionally, respondents living in households with a person with a disability were more likely to be concerned about losing health insurance specifically than their non-disabled counterparts (see Table 2).
Concerns about affording coverage exceeded fears about losing coverage across all income groups, race, ethnicity, disability statuses, and coverage types.
Differences in Healthcare Affordability Burdens
The survey also revealed differences in how Washington respondents experience healthcare affordability burdens by income, insurance type, age, race, ethnicity and disability status.
Income and Age
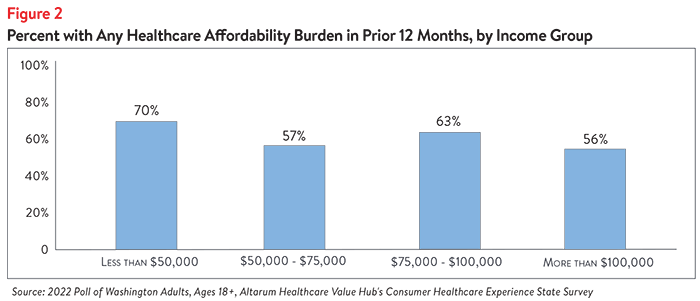
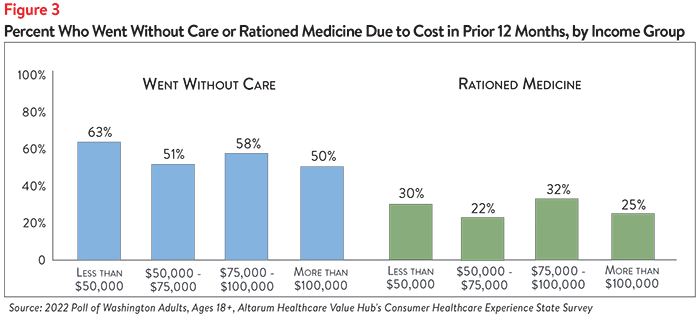
Unsurprisingly, respondents at the lowest end of the income spectrum most frequently reported experiencing one or more healthcare affordability burdens, with nearly three-quarters (70%) of those earning less than $50,000 per year struggling to afford some aspect of coverage or care in the past 12 months (see Figure 2). This may be, in part, due to respondents in this income group reporting high rates of going without care and rationing their medication due to cost (see Figure 3).
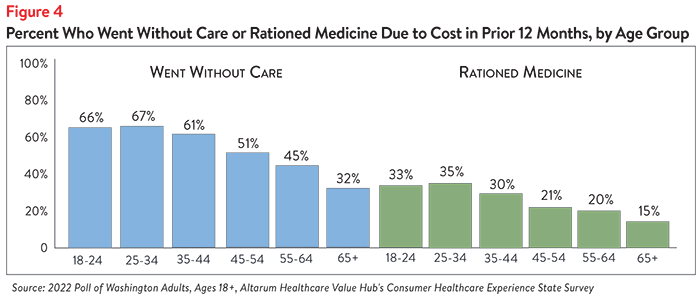
Further analysis found that Washington respondents ages 18-44 are more likely to go without care and ration medication due to cost than respondents ages 45 and up (see Figure 4).
Insurance Type
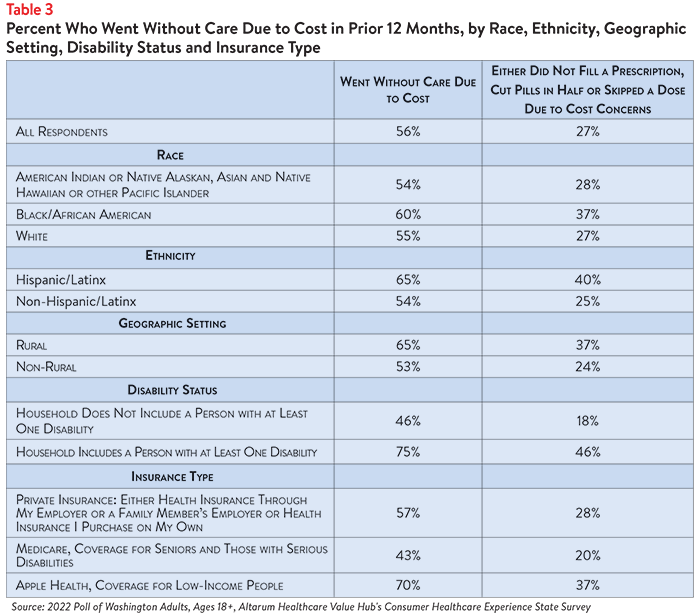
Respondents with Apple Health, Washington’s Medicaid program for people with low incomes, reported the highest rates of going without care due to cost (70%) and the highest rate of rationing medication (37%) (see Table 3). Still, more than half of respondents with employer-sponsored or self-purchased insurance went without care due to cost (57%) and more than 1 in 4 respondents with employer-sponsored or self-purchased insurance reported rationing medication due to cost (28%).
Race/Ethnicity
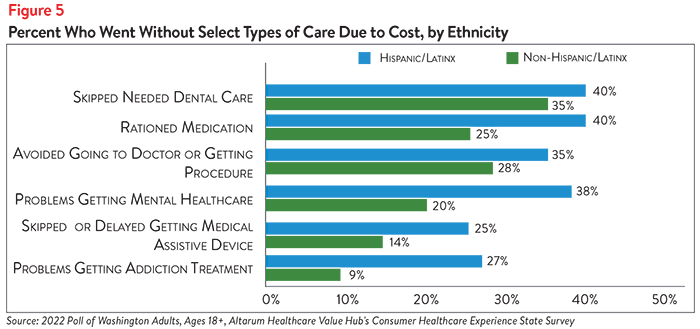
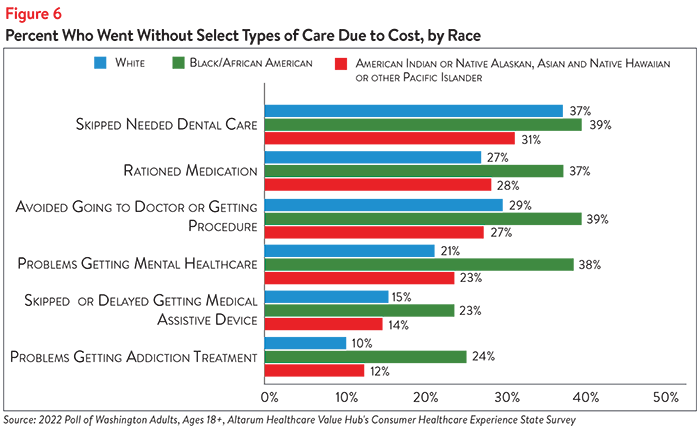
Respondents of color reported higher rates of rationing medication due to cost when compared to white respondents (see Table 3). Further analysis showed that respondents of color also had slightly higher rates of problems getting mental health care, problems getting addiction treatment and skipping needed dental care (see Figures 5 and 6).
Disability Status
Of all the demographic groups measured, respondents living in households with a person with a disability reported the highest rates of going without care and rationing medication due to cost in the past 12 months. Three in four (75%) of respondents in this group went without some form of care and almost half (46%) rationed medication compared to 18% of respondents living in households without a person with a disability (see Table 3). Respondents living in households with a person with a disability also more frequently reported delaying or skipping getting mental healthcare, addiction treatment and dental care, among other healthcare services, than those in households without a person with a disability due to cost concerns (see Table 4).
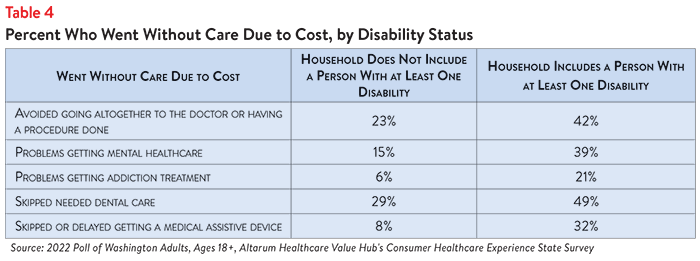
Those with disabilities also face healthcare affordability burdens unique to their disabilities—32% of respondents reporting a disability in their household delayed getting a medical assistive device such as a wheelchair, cane/walker, hearing aid or prosthetic limb due to cost. Just 8% of respondents without a person with a disability (who may have needed such tools temporarily or may not identify as having a disability) reported having this experience.
Encountering Medical Debt
The survey also found differences in the prevalence of financial burdens due to medical bills, including going into medical debt, depleting savings and being unable to pay for basic necessities (like food, heat and housing) by income, race, ethnicity and disability status. Fifty-six percent of Black/African-American respondents and 54% of Hispanic/Latinx respondents reported going into debt, depleting savings or going without other needs due to medical bills, as well as 40% of American Indian or Native Alaskan, Asian and Native Hawaiian or other Pacific Islander, compared to 36% of white respondents (see Table 5).
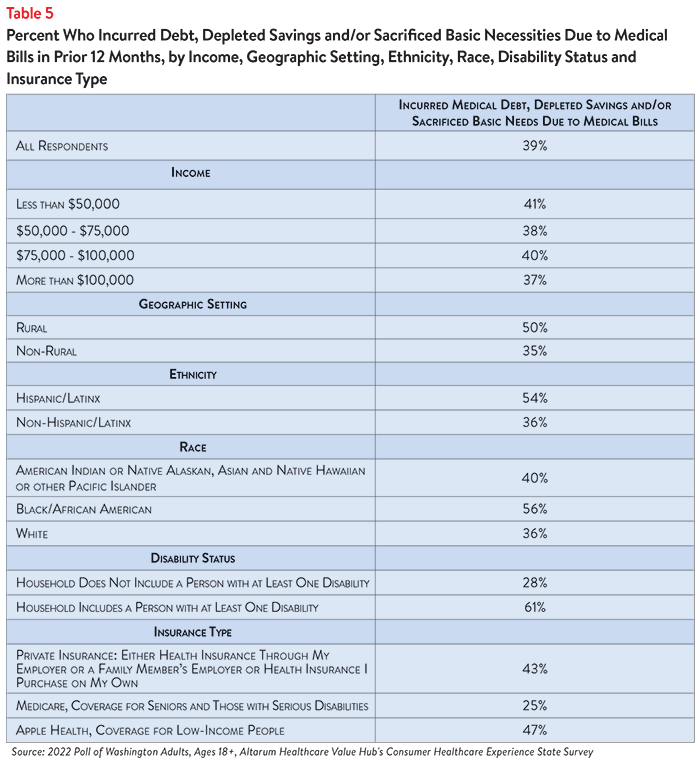
Similarly, respondents living in households with a person with a disability had an even greater disparity, with 3 in 5 respondents (61%) reporting going into debt or going without other needs due to medical bills, compared to just over 1 in 4 (28%) of respondents living in households without a disabled member. In addition, respondents insured through Apple Health reported the highest rate of the above financial burdens due to medical bills (47%), followed by employer-sponsored insurance or self-purchased insurance (43%).
Dissatisfaction with the Health System and Support for Change
In light of Washington respondents' healthcare affordability burdens and concerns, it is not surprising that they are dissatisfied with the health system:
- Just 33% agreed or strongly agreed that “we have a great healthcare system in the U.S.,”
- While 73% agreed or strongly agreed that “the system needs to change.”
To investigate further, the survey asked about both personal and governmental actions to address health system problems.
Personal Actions
Washington respondents see a role for themselves in addressing healthcare affordability. When asked about specific actions they could take:
- 51% of respondents reported researching the cost of a drug beforehand, and
- 72% said they would be willing to switch from a brand name to an equivalent generic drug if given the chance.
However, 24% of respondents chose the response “There is not anything I can do personally to make our health system better.”
Government Actions
Washington respondents see the government as the key stakeholder that needs to act to address health system problems. Moreover, addressing healthcare problems is one of the top priorities that respondents want their elected officials to work on.
At the beginning of the survey, respondents were asked what issues the government should address in the upcoming year. The top vote getters were:
- 46%—Healthcare
- 44%—Economy/Joblessness
- 39%—Affordable Housing
When asked about the top four healthcare priorities the government should work on, respondents said policymakers should:
- 48%—Address high healthcare costs, including prescription drugs
- 37%—Preserve consumer protections preventing people from being denied coverage or charged more for having a pre-existing medical condition
- 34%—Improve Medicare, coverage for seniors and those with serious disabilities
- 30%—Get health insurance to those who cannot afford coverage
Of more than 20 options, Washington respondents believe the reason for high healthcare costs is unfair prices charged by powerful industry stakeholders:
- 76%—Drug companies charging too much money
- 68%—Hospitals charging too much money
- 68%—Insurance companies charging too much money
When it comes to tackling costs, respondents endorsed a number of strategies, including that the government should:
- 92%—Require insurers to provide up-front cost estimates to consumers
- 92%—Show what a fair price would be for specific procedures
- 90%—Ensure patients can’t be charged out-of-network prices if they encounter an out-of-network provider through no fault of their own
- 90%—Require hospitals and doctors to provide up-front cost estimates to consumers
- 87%—Impose price controls on contracts between insurers and healthcare providers
- 82%—Set limits on healthcare spending growth and penalize payers or providers that fail to curb excessive spending growth
Support for Action Across Party Lines
Washington respondents also showed remarkable support for change regardless of political affiliation (see Table 6).
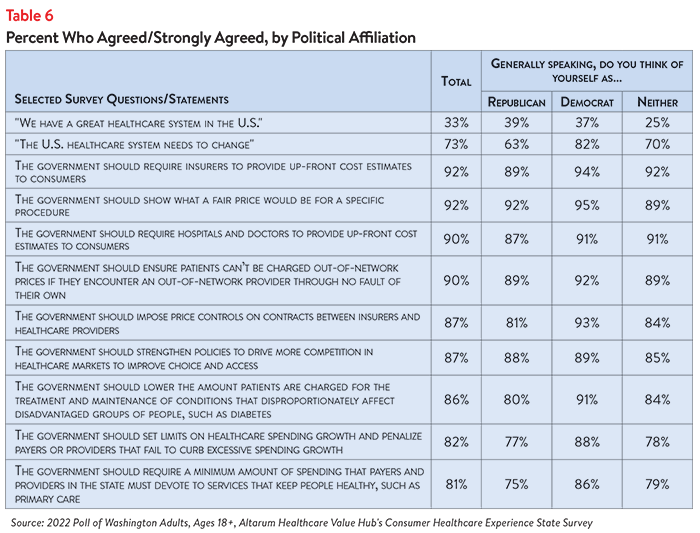
The high burden of healthcare affordability, along with high levels of support for change across political parties, suggests that elected leaders and other stakeholders need to make addressing healthcare costs and the consumer burden a top priority. A wide variety of policy recommendations received support from respondents, including setting limits on healthcare spending growth, imposing price controls on contracts between insurers and healthcare providers, and strengthening policies to drive more competition in healthcare markets. Moreover, the COVID crisis has led state residents to take a hard look at how well health and public health systems are working for them, with strong support for a wide variety of actions. Annual surveys can help assess whether or not progress is being made.
Notes
1. Of the current 56% of Washington respondents who encountered one or more cost-related barriers to getting healthcare during the prior 12 months, 20% did not fill a prescription, while 20% cut pills in half or skipped doses of medicine due to cost.
2. Median household income in Washington was $77,006 (2016-2020). U.S. Census, Quick Facts. Retrieved from: U.S. Census Bureau QuickFacts: Washington
3. Regarding race/ethnicity categories, the survey separates Black/African American, Hispanic/Latinx and White respondents because there were at least 100 responses for each group. Rather than grouping and labeling the remaining respondents who were American Indian or Native Alaskan, Asian and Native Hawaiian or other Pacific Islander into an “Other” category, this brief instead listed them out together in a single remaining category.
4. Regarding disability status, respondents were asked if they or someone in their household identifies as having a disability or long-term health condition related to mobility, cognition, independent living, hearing, vision and self-care.
Methodology
Altarum’s Consumer Healthcare Experience State Survey (CHESS) is designed to elicit respondents’ unbiased views on a wide range of health system issues, including confidence using the health system, financial burden and views on fixes that might be needed.
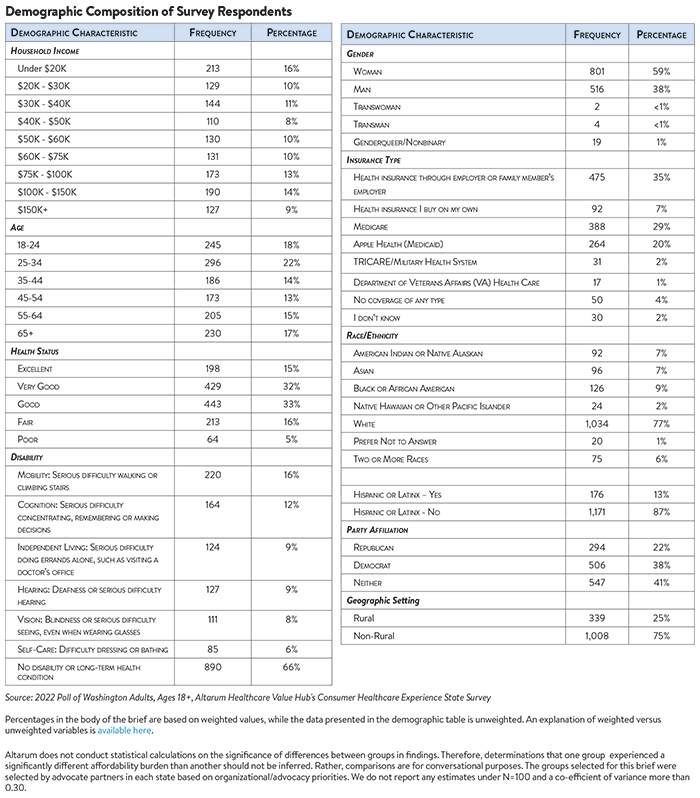
This survey, conducted from August 3 to August 16, 2022, used a web panel from online survey company Dynata with a demographically balanced sample of approximately 1,502 respondents who live in Washington. Information about Dynata’s recruitment and compensation methods can be found here. The survey was conducted in English or Spanish and restricted to adults ages 18 and older. Respondents who finished the survey in less than half the median time were excluded from the final sample, leaving 1,347 cases for analysis. After those exclusions, the demographic composition of respondents was as follows, although not all demographic information has complete response rates:

Washington Survey Reports
2023
Statewide Report
2022
Statewide Reports
Prescription Drug Affordability
Report Download
|
HEALTHCARE VALUE HUB
The Healthcare Value Hub can help you find free, timely information about policies and practices to achieve health systems that are equitable, affordable, and focused on the goals and needs of the people the system is meant to serve.
Share
![]()
![]()
![]()

Follow
![]()
![]()


![]()