Connecticut Residents Struggle to Afford High Healthcare Costs; COVID Fears Add to Support for a Range of Government Solutions Across Party Lines
Survey context: During the survey period, Connecticut residents were under a “Stay Safe, Stay at Home” Executive Order, which suspended non-essential in-person functions. Initial steps at reopening began on May 20, two days after the close of the survey period.1 COVID-19 new cases, hospitalizations and deaths peaked approximately two weeks prior to the beginning of the survey period. Weekly initial unemployment claims averaged 49,471 in April and 22,070 in May 2020, compared to 2,339 in May 2019.2
A Range of Healthcare Affordability Burdens
Like many Americans, Connecticut adults currently experience hardship due to high healthcare costs. All told, 51% of Connecticut adults experienced one or more of the following healthcare affordability burdens in the prior 12 months:
1) Being Uninsured Due to High Premium Costs
With Connecticut's relatively low uninsurance rate of 5%,3 we received too few responses to provide a reliable estimate for this statistic. However, these respondents are included in the overall “burdened” population.
2) Delaying or Forgoing Healthcare Due to Cost
Almost half of Connecticut adults (44%) encountered one or more cost-related barriers to getting healthcare during the prior 12 months, including:
- 26%—Skipped needed dental care
- 24%—Delayed going to the doctor or having a procedure done
- 20%—Avoided going to the doctor or having a procedure done altogether
- 19%—Skipped a recommended medical test or treatment
- 19%—Cut pills in half, skipped doses of medicine or did not fill a prescription4
- 10%—Had problems getting mental healthcare
Moreover, cost was by far the most frequently cited reason for not getting needed medical care, exceeding a host of other barriers like transportation, difficulty getting an appointment and lack of childcare.
Of the various types of medical bills, the ones most frequently associated with an affordability barrier were doctor bills, dental bills and prescription drugs, likely reflecting the frequency with which Connecticut adults seek these services—or, in the case of dental, perhaps lower rates of coverage for these services.
3) Struggling to Pay Medical Bills
Other times, Connecticut adults got the care they needed but struggled to pay the resulting bill. Nearly one quarter of Connecticut adults (24%) experienced one or more of these struggles to pay their medical bills:
- 9%—Contacted by a collection agency
- 7%—Used up all or most of their savings
- 6%—Racked up large amounts of credit card debt
- 6%—Placed on a long-term payment plan
- 6%—Unable to pay for basic necessities like food, heat or housing
- 6%—Borrowed money, got a loan or another mortgage on their home
High Levels of Worry About Affording Healthcare in the Future
Connecticut adults also exhibit high levels of worry about affording healthcare in the future. Overall, 3 in 4 adults (74%) report being “worried” or “very worried” about affording some aspect of healthcare in the future, including:
- 59%—Medical costs when elderly
- 55%—Cost of a serious illness or accident
- 48%—Cost of prescription drugs
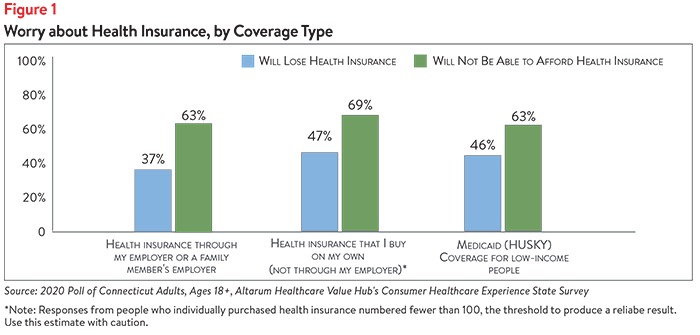
In addition, 59% of respondents are “worried” or “very worried” about not being able to afford health insurance in the future. These concerns vary by type of insurance coverage, with people who buy insurance on their own and those on Medicaid being most concerned about losing their coverage. Concerns about affording health insurance exceeded fears about losing coverage across all insurance types (see Figure 1).
Income Differences in Healthcare Affordability Burdens
The survey also revealed income differences in how Connecticut adults experience healthcare affordability burdens.
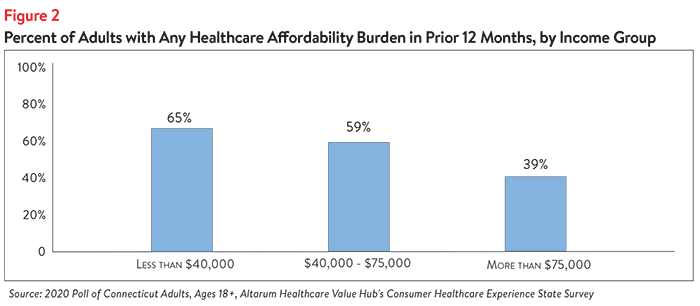
Affordability burdens affect families quite far up the income ladder, with more than 60% of residents with household incomes of $75,0005 or below facing healthcare affordability burdens (see Figure 2).
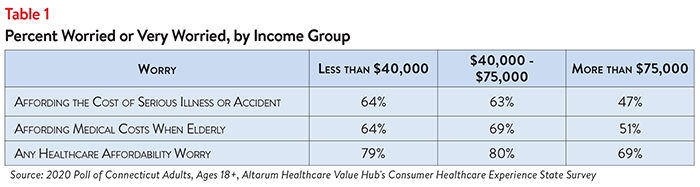
Residents in the lowest income brackets report higher levels of worry; however, even households making more than $75,000 per year are worried about affording healthcare (see Table 1).
COVID Worries
In addition to affordability worries, Connecticut adults were asked about their top worries related to the COVID crisis.6 When asked about “affording treatment of coronavirus/COVID-19 if you need it,” 54% of respondents were worried or very worried.
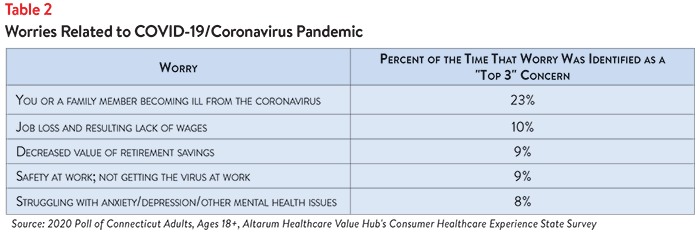
Separately, out of twelve possible responses, respondents were asked to pick the top three things they were most worried about (see Table 2). “Becoming ill from the virus” not only ranked as the top worry among the choices, but it exceeded other worries by a wide margin, garnering about twice as many “votes” as the next most common worry, “Job loss and resulting lack of wages.”
In smaller numbers, Connecticut adults worried about many other issues, including: job loss and resulting loss of health coverage (6%), children missing school/child care (6%), affording treatment if someone in your family gets the virus (5%), something else (5%), unavailability of COVID treatment if they or a family member gets sick (5%) and ability to vote safely (4%).
Dissatisfaction with the Health System and Support for Change
In light of these healthcare affordability and COVID concerns, it is not surprising that Connecticut adults were extremely dissatisfied with the health system. Statewide:
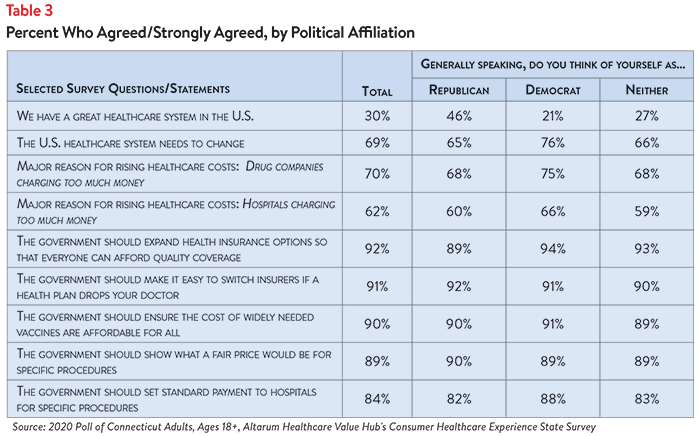
- Just 30% agreed or strongly agreed that “we have a great healthcare system in the U.S.,”
- While 69% agreed or strongly agreed that “the system needs to change."
The survey asked about both personal and governmental actions to address health system problems.
Personal Actions
Connecticut adults do see a role for themselves in addressing healthcare affordability. When asked to rank the three personal actions that would be most effective in addressing the affordability of healthcare (out of ten options), top vote getters were:
- 60%—Taking better care of my personal health
- 39%—Write or call my STATE representative asking them to take action
- 34%—Write or call my FEDERAL representative asking them to take action
- 32%—Research treatments myself, before going to the doctor
They also reported specific actions they have already taken, like researching the cost of a drug beforehand (55%), as well as action they should be taking—72% said they would switch from a brand to a generic drug if given a chance.
Government Actions
But far and away, Connecticut residents see government as the key stakeholder that needs to act to address health system problems. Moreover, addressing healthcare problems was a higher priority than other issues that Connecticut residents want their elected representatives to work on.
At the beginning of the survey, respondents were asked what issues the government should address in the upcoming year. The top vote getters were:
- 67%—Healthcare
- 63%—Economy/Joblessness
- 47%—Taxes
The economic woes brought on by the COVID crisis likely contributed to “Economy/Joblessness” as a primary concern, but addressing healthcare remained the top issue that Connecticut adults want their elected representatives to work on.
When asked about the top three healthcare priorities the government should work on, top vote getters were:
- 52%—Address high healthcare costs, including prescription drugs
- 35%—Get health insurance to those who cannot afford coverage
- 34%—Preserve consumer protections, like: you can't be denied coverage or charged more if you have a pre-existing medical condition
Of more than 20 options, Connecticut adults believe the reason for high healthcare costs is unfair prices charged by powerful industry stakeholders:
- 70%—Drug companies charging too much money
- 64%—Insurance companies charging too much money
- 62%—Hospitals charging too much money
When it comes to tackling costs, respondents endorsed a number of strategies, including:
- 92%—Expand health insurance options so that everyone can afford quality coverage
- 91%—Make it easy to switch insurers if a health plan drops your doctor
- 90%—Ensure the cost of widely needed vaccines are affordable for all
- 89%—Show what a fair price would be for specific procedures
- 89%—Require hospitals and doctors to provide up-front cost estimates to consumers
- 89%—Require insurers to provide up-front cost estimates to consumers
- 84%—Set standard payments to hospitals for specific procedures
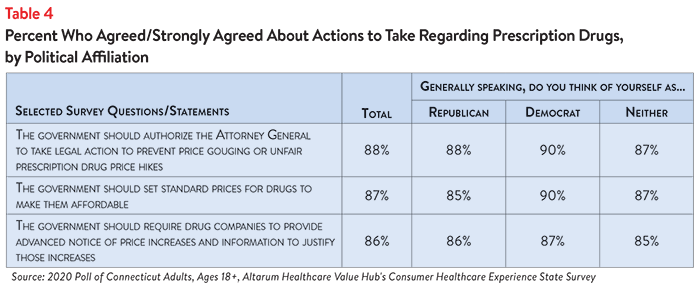
- There were also high levels of support for strategies to lower prescription drug costs:
- 88%—Prohibit drug companies from charging more in the U.S. than abroad
- 88%—Authorize the Attorney General to take legal action to prevent price gouging or unfair prescription drug price hikes
- 87%—Set standard prices for drugs to make them affordable
- 86%—Require drug companies to provide advance notice of price increases and information to justify those increases
Support for Action Across Party Lines
What is remarkable about the findings is high support for change regardless of respondents' political affiliation (see Tables 3 and 4).
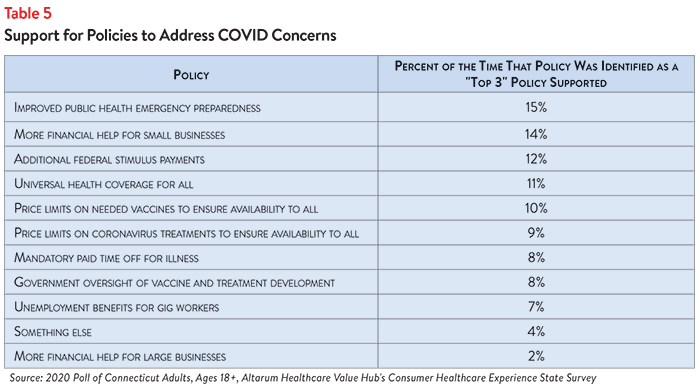
Policies to Address COVID Concerns
In addition to residents' views on the policies and approaches above, new questions were asked about support for and against policies related to the COVID crisis. Out of eleven possible responses, respondents were asked to pick the top three policies that would help address COVID-related problems. There was significant diversity in the policies supported, with two front runners, “Improve public health emergency preparedness” and “More financial help for small businesses,” closely followed by a large group of policies receiving nearly equal numbers of votes (see Table 5). The least supported policy was “More financial help for large businesses.”
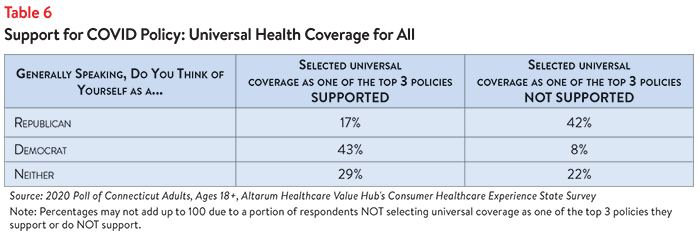
Far fewer respondents answered when asked about policies they did NOT support. Among the responses we received, 22% indicated that they did not support “More financial help for large businesses.” Trailing behind that (with 14% of the votes) was “Universal health coverage for all,” although more votes were cast overall in support. In this area, there was a lack of agreement across party lines, with Republicans far more likely to NOT support “Universal health coverage for all” as a means to address COVID-19 concerns, compared to Democrats and those not affiliated with either party (see Table 6). It is important to note, however, that when asked generically about “Expanding health insurance options so that everyone can afford quality coverage,” 92% of respondents agreed or strongly agreed with this policy as a means of improving affordability.
When asked about the policies they did NOT support, respondents were given the option of selecting “I support all of the policies listed.” Twenty-three percent of respondents selected this option.
The high burden of healthcare affordability, along with high levels of support for change, suggest that elected leaders and other stakeholders need to make addressing this consumer burden a top priority. Moreover, the current COVID crisis is leading state residents to take a hard look at how well health and public health systems are working for them, with strong support for a wide variety of actions. Annual surveys can help assess whether or not progress is being made.
Comparing 2020 Results to the 2018 CHES Survey
We caution readers against drawing strong conclusions about changes observed between the 2018 and 2020 CHES surveys. While the findings from the two surveys are remarkably consistent, small differences in the weighting approach and in the instrument itself (most significantly the addition of the COVID questions) indicate that direct comparisons should not be made. For more information on the Connecticut state surveys, go to www.healthcarevaluehub.org /connecticut-state-survey.
Notes
1. Governor Lamont Signs Executive Order Asking Connecticut Businesses and Residents: 'Stay Safe, Stay Home,' Press Release (March 20, 2020) and Reopen Connecticut is Working to Get Connecticut Back in Business in the Safest Way Possible, Reopen Connecticut (May 20, 2020).
2. COVID-19 Tests, Cases, Hospitalizations and Deaths (Statewide), Connecticut Department of Public Health. Retrieved from: https://data.ct.gov/Health-and-Human-Services/COVID-19-Tests-Cases-Hospitalizations-and-Deaths-S/rf3k-f8fg. Average Weekly Unemployment Initial Claims Benefits, Connecticut Department of Labor. Retrieved from: https://www1.ctdol.state.ct.us/lmi/awiclaims2.asp
3. Kaiser Family Foundation, Health Insurance Coverage of the Total Population, 2018. Retrieved from: https://www.kff.org/other/state-indicator/total-population/?currentTimeframe=0&sortModel=%7B%22colId%22:%22Location%22,%22sort%22:%22asc%22%7D
4. Of the current 44% of Connecticut adults who encountered one or more cost-related barriers to getting healthcare during the prior 12 months, 14% did not fill a prescription, while 12% cut pills in half or skipped doses of medicine due to cost.
5. Median household income in Connecticut was $76,106 (2014-2018). U.S. Census, Quick Facts. Retrieved from: https://www.census.gov/quickfacts/fact/table/CT,US/PST045219
6. COVID-19 is the disease caused by the Coronavirus, which was characterized as a pandemic by the World Health Organization on March 11, 2020. For a comparison of how respondents from Connecticut and three other states answered our COVID questions, please see Healthcare Value Hub, How COVID Has Shaped Residents' Broader Attitudes Towards the Health System, Data Brief No. 86.
Methodology
Altarum’s Consumer Healthcare Experience State Survey (CHESS) is designed to elicit respondents’ unbiased views on a wide range of health system issues, including confidence using the health system, financial burden and views on fixes that might be needed.
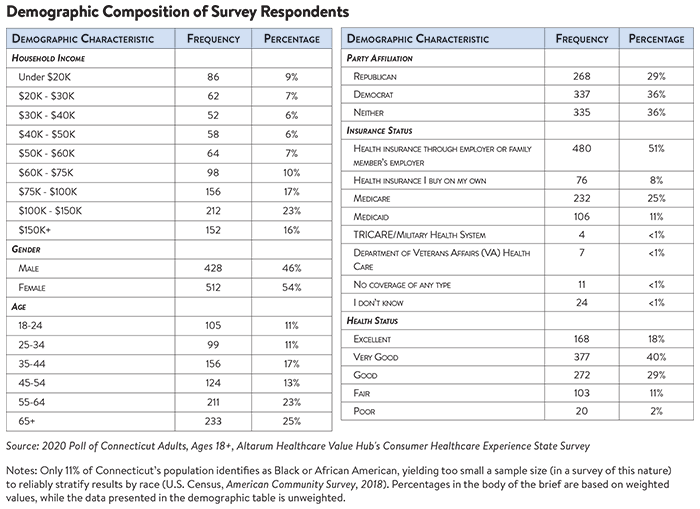
The survey used a web panel from Dynata with a demographically balanced sample of approximately 1,000 respondents who live in Connecticut. The survey was conducted only in English and restricted to adults ages 18 and older. Respondents who finished the survey in less than half the median time were excluded from the final sample, leaving 940 cases for analysis. After those exclusions, the demographic composition of respondents was as follows, although not all demographic information has complete response rates:

HEALTHCARE VALUE HUB
The Healthcare Value Hub can help you find free, timely information about policies and practices to achieve health systems that are equitable, affordable, and focused on the goals and needs of the people the system is meant to serve.
Share
![]()
![]()
![]()

Follow
![]()
![]()


![]()