 |
Browse by Strategy
Infographic
|
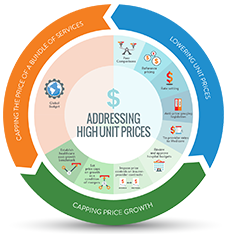
Table Download
|
On this Topic
- Healthcare Value Hub (November 2018)
Strategies to Address High Unit Prices: A Primer for States - Healthcare Value Hub (November 2018)
Healthcare Cost Driver: High and Rising Unit Prices - RAND Corporation (2020)
Nationwide Evaluaiton of Health Care Prices Paid by Private Health Plans - Urban Institute & UC Hastings Law (January 2020)
Addressing Health Care Market Consolidation and High Prices - Kaiser Family Foundation (April 2020)
How Much More Than Medicare Do Private Insurers Pay? A Review of the Literature
Improving Value
High Unit Prices—Remedies
High Unit Prices are the Primary Driver of Rising Healthcare Spending in the U.S.
When U.S. healthcare prices are compared to those in other countries or when healthcare price growth is compared to the growth of non-healthcare commodities, there is general agreement that prices seem excessive. Early efforts to quantify excessive prices stem from the Institute of Medicine’s identification of “pricing failures” as a category of healthcare waste. Pricing failures occur when the price of a product or service exceeds “the cost of production plus a reasonable profit.” Using this definition, researchers estimate that excess prices drive $230-$240 billion in wasteful healthcare spending each year (as of 2019).1
Moreover, evidence is clear that year-over year increases in the prices of healthcare services—not the number of services provided—are the predominant reason for our high growth in annual health spending. High annual price growth is particularly prevalent in the commercial sector and for outpatient hospital services and prescription drugs.2
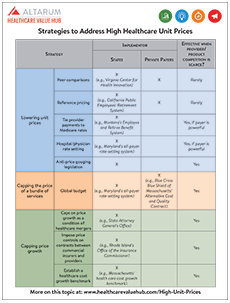
Strategies to Address High Unit Prices
States, in their role as regulators and payers, and commercial insurers are important stakeholders when it comes to keeping healthcare prices in check. Evidence-based strategies available to these actors—depending on the market power of local providers—are described below and in the Strategies to Address High Unit Prices table.
Click on the strategies below to learn more.
Provider “peer comparisons” are commonly employed to control unnecessary utilization, but anecdotal evidence suggests that they can motivate high-cost providers to lower their prices as well.3 Prior to 2010, payments to New Hampshire’s most expensive hospital exceeded those of its competitors by nearly 50 percent. Historically, the state’s largest insurer had been unable to decrease prices due to the hospital’s prominent reputation and loyal, wealthy patient base. But evidence of excessive prices—made public on the state’s price transparency website—enabled the insurer to brand the hospital as a pricing outlier, garner public support and negotiate lower prices. Market observers testified that, despite limited public awareness of the price transparency tool, publicly identifying high-priced providers shifted the balance of power towards the state’s insurers and narrowed price variation over time.4
Click here for more on this topic.
Reference pricing strives to contain healthcare costs by establishing a “reference price” that a payer will contribute towards the cost of a certain procedure and requiring patients to pay expenses in excess of the established amount. While the primary goal is to incentivize patients to seek care from lower- to moderately priced providers, a now famous study from the California Public Employees’ Retirement System (CalPERS) showed that high-priced providers of knee and hip replacement surgeries lowered their prices to meet the established rate in order to remain competitive.5 It is important to recognize, however, that reference pricing—like other forms of price transparency—could theoretically cause low-price providers to raise their prices to meet the market rate. However, this phenomenon has not been widely observed.6
Public and private payers can increase the likelihood that reference pricing will effectively lower costs by focusing on procedures that are routine, elective and non-urgent; are offered by many providers; have high variation in prices; have little variation in quality; and are widely identified as the appropriate mode of treatment.7 Care must be taken to ensure that patients can easily navigate to high quality providers meeting the reference price.
Click here for more on this topic.
Global budgets are a payment model in which providers—typically hospitals—are paid a prospectively-set, fixed amount for the total number of inpatient, outpatient and emergency services provided annually. Hospitals are responsible for expenditures in excess of the set amount in addition to quality outcomes, thus creating an incentive to reduce unnecessary utilization and invest in prevention.
Maryland has incorporated global budgets into its long-running all-payer rate setting program with notable success.8 Other states, like Pennsylvania, are now testing the utility of the model in a non-rate setting environment. Pennsylvania’s plan differs from Maryland’s in that it focuses exclusively on rural areas, which generally experience limited competition due to provider shortages. As of 2019, the Pennsylvania Rural Health Model is in the early stages of implementation and has yet to be evaluated.9
Click here for more on this topic.
• Hospital/Physician Rate Setting
Maryland’s all-payer rate setting system for hospitals establishes uniform rates for services paid by all payers operating in the state. As a result, Medicare, Medicaid and commercial payers pay the same price for each service that hospitals provide.10 Evidence suggests that all-payer rate setting has limited growth in annual per capita hospital spending and produced considerable savings for the Medicare program from 2014-2016.11 Maryland received federal approval to extend its all-payer model to non-hospital providers on a voluntary basis beginning in 2019.12
Similarly, Vermont is experimenting with all-payer rate setting for the state’s Accountable Care Organizations (ACOs). In 2017, all major payers—Medicare, Medicaid and Blue Cross Blue Shield of Vermont (the state’s dominant commercial insurer)—committed to paying participating ACOs using the same value-based payment methodology, rather than the traditional fee-for-service. In addition to quality and outcomes measures, the state will monitor whether the model limits annual per capita expenditure growth for Medicare and non-Medicare beneficiaries alike.13 An early evaluation of one of the state’s largest ACOs—OneCare Vermont—failed to demonstrate cost savings in the first year of implementation.14 A forthcoming evaluation by NORC will reveal the model’s impact on spending growth over time.15
Click here for more on this topic.
• Anti-Price Gouging Legislation
Pharmaceutical manufacturers and pharmacy benefit managers have come under fire for various practices that stifle competition and raise prices.16 In recent years, several states have introduced legislation to prevent harmful, and even unethical, activities such as “price-gouging”—when a manufacturer uses its competitive advantage to charge unreasonably high prices for “essential off-patent or generic drugs.” As of October 2018, Maryland is the only state to pass such legislation (applicable only to generic drugs), which was struck down on constitutional grounds.17 In 2019, the U.S. Supreme Court declined to consider the Maryland Attorney General’s appeal.
Click here for more on this topic.
• Caps on Price Growth as a Condition of Healthcare Mergers
As discussed in the Healthcare Value Hub’s 2019 Easy Explainer When Antitrust Fails: Limiting Consumer Harm from Healthcare Consolidation, states states often place conditions on healthcare mergers in attempt to mitigate potential anti-competitive effects.18 These conditions, delivered in the form of consent decrees, may include prohibitions against raising prices above certain thresholds for a specified period of time. Evidence suggests that price caps as a condition of healthcare mergers are effective, but typically only in the near-term. Once the period of regulation is over, providers tend to increase their prices – reversing the desired effect.19
• Review and Approve Hospital Budgets
Vermont’s legislature charged the Green Mountain Care Board (GMCB) with overseeing hospital budgets in 2012. Each year, the GMCB sets a maximum growth target limiting the rate that hospitals’ net patient revenue is allowed to increase over the previous year. The GMCB monitors hospital payments, in addition to net patient revenue, to ensure that hospital budgets are fair.20
Hospitals can request increases in the amount their net patient revenue is allowed to grow. Increases may be permitted if the GMCB deems necessary, for example, “if the extra money is needed to fulfill government mandates or if the expense meets other standards that the Board has set.”21 By law, the GMCB has strong enforcement authority to keep hospitals within their budgets, including the ability to impose financial penalties and take hospitals to court.
• Tie Provider Payments to Medicare Rates
States can leverage their negotiating power as major employers to dictate the prices that providers can charge state employee health plans. In 2016, Montana “capped” payment for all hospital services at an average of 234 percent of Medicare rates, saving the state approximately $15.6 million in the second year of implementation.22
Note: Whether Medicare prices are an appropriate benchmark for rate setting is debated. The Hub’s Medicare Rates as a Benchmark: Too Much, Too Little or Just Right? explores the pros and cons of this approach.
• Impose Price Controls on Contracts Between Commercial Insurers and Providers
Rhode Island’s Office of the Insurance Commissioner created affordability standards in 2010 that imposed price controls on contracts between commercial insurers and providers. The price controls included annual price inflation caps (equal to the Medicare price index plus 1 percent) for inpatient and outpatient services and transitioned traditional hospital payments to value-based payments offering a fixed fee for a given type of diagnosis and inpatient stay. A 2019 study published in Health Affairs found that the price controls contributed to a decline in total spending growth and out-of-pocket spending from 2007 to 2016.23
• Establish a Healthcare Cost Growth Benchmark
Some states have established statewide spending targets (also known as benchmarks) to constrain total hospital or healthcare spending growth.24 Massachusetts was the first state to create a total healthcare spending benchmark in 2012 and a few others—Vermont, Delaware, Rhode Island, Oregon and Connecticut—have followed suit.
While data from Massachusetts shows us that even voluntary targets can reign in healthcare cost growth,25 mandatory targets may be even more impactful. Complementary quality benchmarks, such as those established in Delaware, are also important to ensure that efforts to reduce cost growth do not negatively impact health outcomes.
Click here for more on this topic.
Notes
1. Shrank, William H., Teresa L. Rogstad, and Natasha Parekh, “Waste in the US Health Care System: Estimated Costs and Potential for Savings,” JAMA, Vol. 322, No. 15 (Oct. 15, 2019).
2. Health Care Cost Institute, 2018 Health Care Cost and Utilization Report, Washington, D.C. (February 2020).
3. Hunt, Amanda, Non-Financial Provider Incentives: Looking Beyond Provider Payment Reform, Altarum Healthcare Value Hub, Washington, D.C. (February 2018).
4. Quincy, Lynn, and Amanda Hunt, Revealing the Truth about Healthcare Price Transparency, Altarum Healthcare Value Hub, Washington, D.C. (June 2018).
5. Robinson, James, and Timothy Brown, Evaluation of Reference Pricing: Final Report, letter to David Cowling of CalPERS (May 15, 2013).
6. Altarum Healthcare Value Hub, Reference Pricing, https://healthcarevaluehub.org/improving-value/browse-strategy/reference-pricing/ (accessed on Oct. 18, 2018). See also: Quincy and Hunt (June 2018).
7. Slevin, Geraldine, and Julie Silas, Creating a Consumer-Friendly Reference Pricing Program, Consumers Union, Yonkers, N.Y. (August 2014).
8. Cohen, Stephanie, and Erin Butto, Hospital Rate Setting: Promising, but Challenging to Replicate, Altarum Healthcare Value Hub, Washington, D.C. (August 2017).
9. Altarum Healthcare Value Hub, State Strategies to Better Healthcare Value, https://healthcarevaluehub.org/advocate-resources/key-state-strategies-better-healthcare-value/ (accessed Oct. 18. 2018).
10. For more information, see: Cohen & Butto (August 2017).
11. Health Services Cost Review Commission, Maryland’s All-Payer Hospital Model Results: Performance Year Three, Baltimore, M.D. (March 2018).
12. Office of Governor Larry Hogan, “Governor Larry Hogan Announces Federal Approval of “Maryland Model” All-Payer Contract,” News Release (May 14, 2018).
13. Centers for Medicare & Medicaid, Vermont All-Payer ACO Model, https://innovation.cms.gov/initiatives/vermont-all-payer-aco-model/index.html (accessed on Oct. 23, 2018).
14. Hostetter, Martha, Sarah Klein and Douglas McCarthy, Vermont’s Bold Experiment in Community-Driven Health Care Reform, The Commonwealth Fund (May 10, 2018).
15. NORC at the University of Chicago, Vermont All-Payer ACO Model Evaluation, https://www.norc.org/Research/Projects/Pages/vermont-all-payer-aco-model-evaluation.aspx (accessed on Feb. 28, 2020).
16. Altarum Healthcare Value Hub, High Drug Spending: What’s the Prescription?, https://healthcarevaluehub.org/advocate-resources/high-drug-spending/ (accessed on Oct. 18. 2018).
17. The 4th circuit court overturned the law on the grounds that it “regulates trade that happens beyond Maryland’s borders, and so is prohibited by the so-called dormant commerce clause.”
18. Hunt, Amanda, When Antitrust Fails: Limiting Consumer Harm from Healthcare Consolidation, Altarum Healthcare Value Hub, Washington, D.C. (October 2019).
19. Berenson, Robert A., et al., Addressing Health Care Market Consolidation and High Prices, Urban Institute, Washington, D.C. (January 2020).
20. Green Mountain Care Board, The Green Mountain Guide to Hospital Budget Review, Montpelier, V.T. (August 2012).
21. Ibid.
22. Appleby, Julie, “‘Holy Cow’ Moment Changes How Montana’s State Health Plan Does Business,” Kaiser Health News (June 20, 2018).
23. Baum, Aaron et al., “Health Care Spending Slowed After Rhode Island Applied Affordability Standards To Commercial Insurers,” Health Affairs, Vol. 38, No. 2 (February 2019). See also: Rhode Island Office of the Health Insurance Commissioner, Reform and Policy - Affordability Standards, http://www.ohic.ri.gov/ohic-reformandpolicy-affordability.php (accessed on Feb. 28, 2020).
24. Altarum Healthcare Value Hub, Improving Value: Global Budgets, https://healthcarevaluehub.org/improving-value/browse-strategy/global-budgets (accessed on Feb. 28, 2020).
25. Bartlett, Jessica, “Mass. Kept Health Care Cost Growth to 3.1% in 2018,” Boston Business Journal (Oct. 8, 2019).
HEALTHCARE VALUE HUB
The Healthcare Value Hub can help you find free, timely information about policies and practices to achieve health systems that are equitable, affordable, and focused on the goals and needs of the people the system is meant to serve.
Share
![]()
![]()
![]()

Follow
![]()
![]()


![]()