New Mexico Survey Respondents Face Challenges Navigating the Health Care System, Understanding Cost-Sharing Obligations; Express Bipartisan Support for Government Action
A 2024 survey of more than 1,400 New Mexico adults, conducted from June 6 to July 8, 2024, found
that many respondents face challenges confidently navigating the health care system and understanding
their cost-sharing obligations. These challenges are sometimes attributed to insufficient levels of health
insurance literacy or health literacy, which is associated with poorer health outcomes, lower patient
satisfaction, and higher costs.1,2,3 This brief surfaces respondents’ experiences operating within the health
care system, interpreting their cost-sharing obligations and highlights support for related policy solutions.
Confidence Obtaining Care, Understanding Cost, Resolving Issues
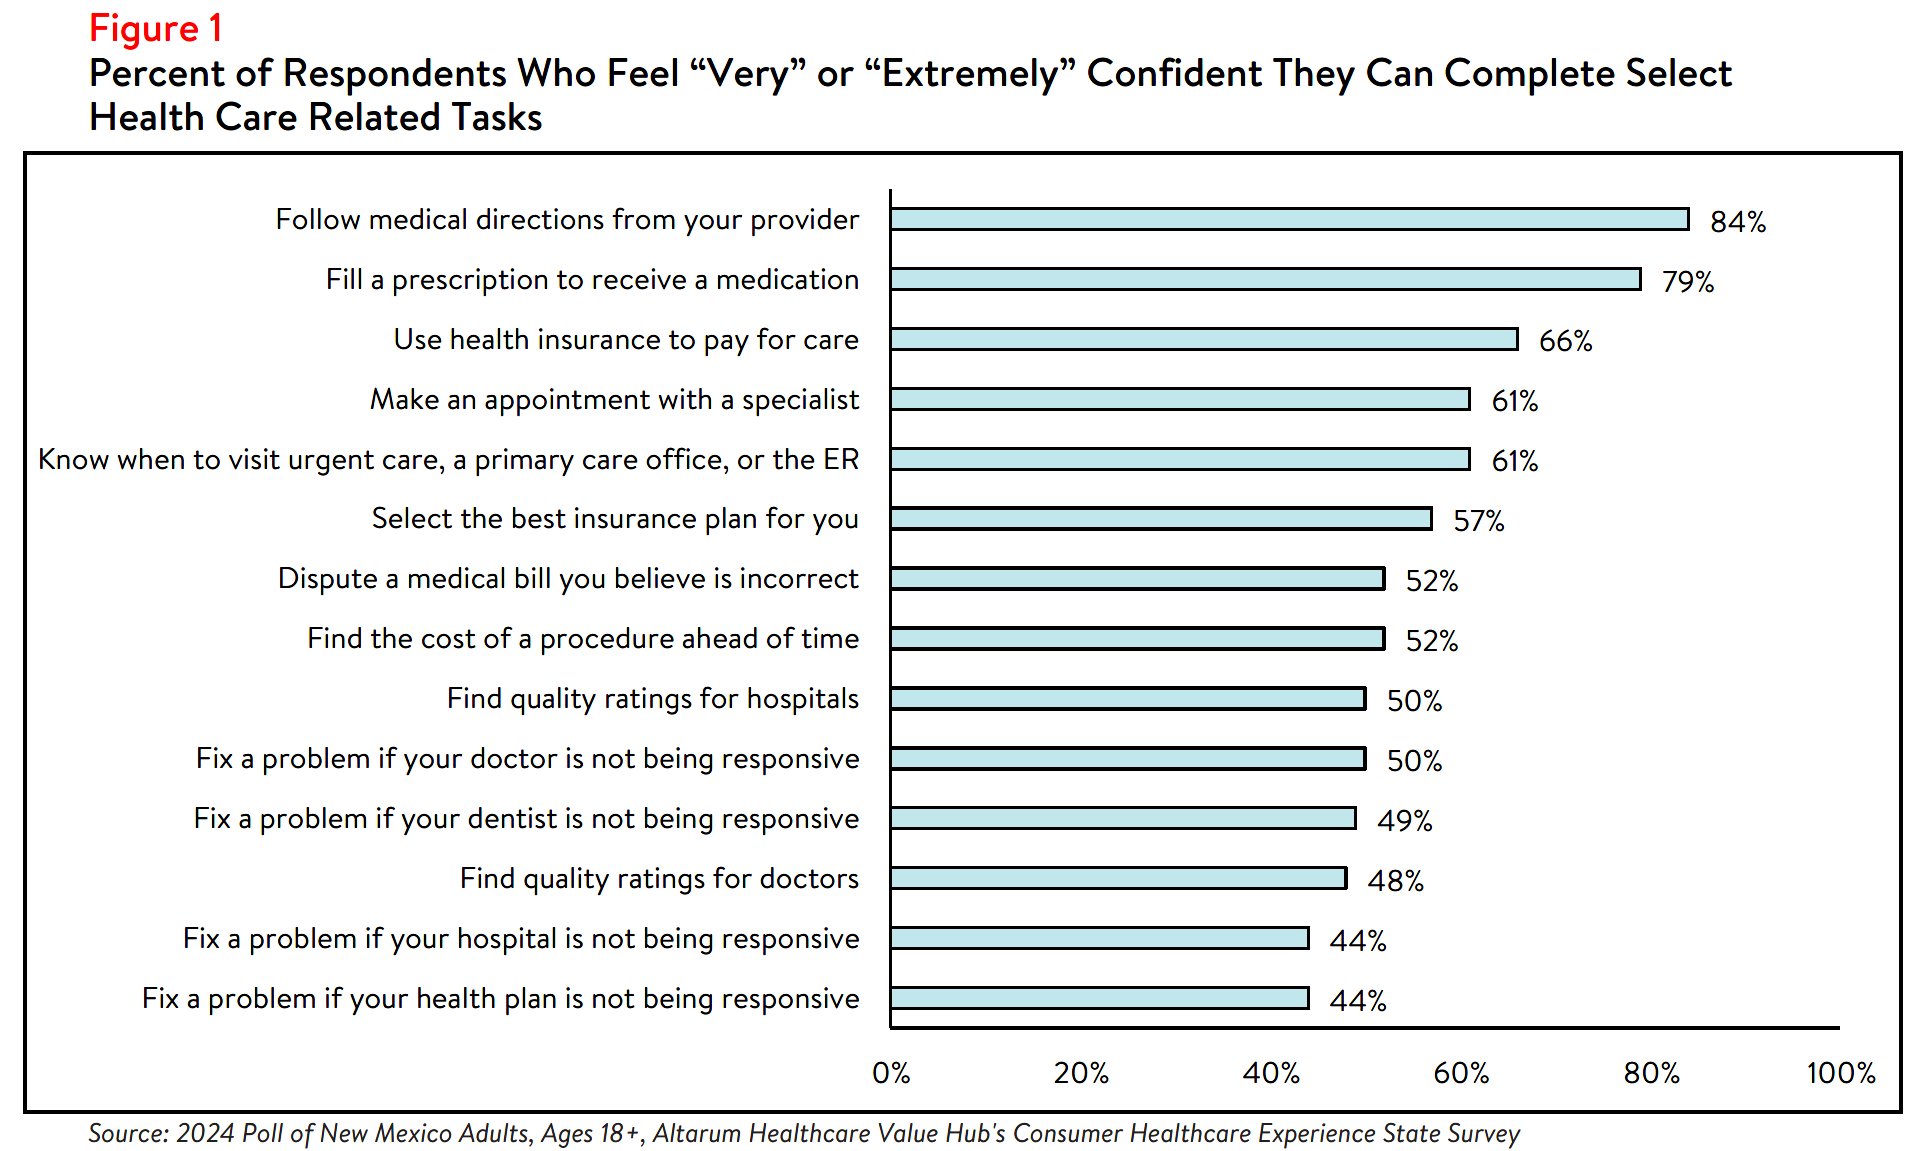
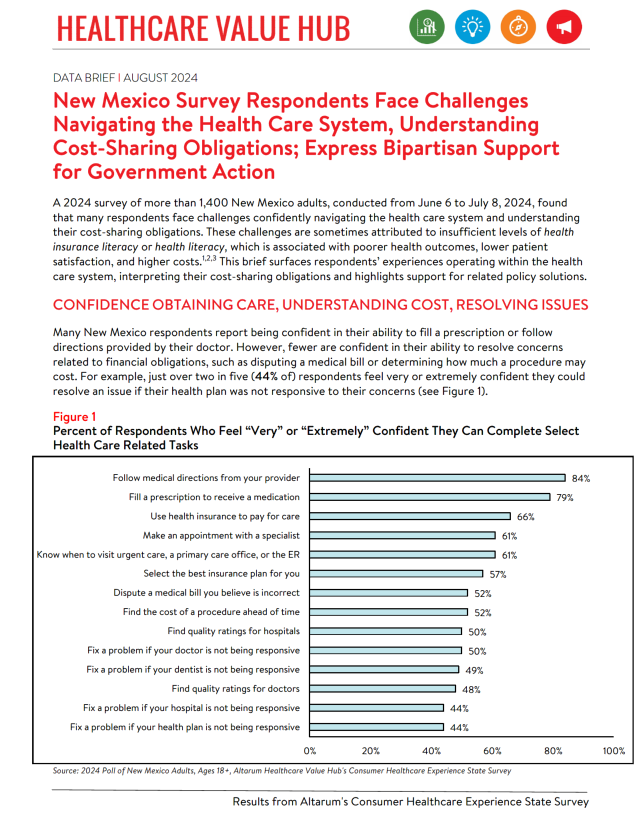
Many New Mexico respondents report being confident in their ability to fill a prescription or follow
directions provided by their doctor. However, fewer are confident in their ability to resolve concerns
related to financial obligations, such as disputing a medical bill or determining how much a procedure may
cost. For example, just over two in five (44% of) respondents feel very or extremely confident they could
resolve an issue if their health plan was not responsive to their concerns (see Figure 1).
Finding/Interpreting Health Care Cost and Quality Information
Limited knowledge of health care quality or costs can hinder consumers' ability to budget for care, which
can be especially detrimental to the under- and uninsured.4 Among New Mexico respondents, just over
half (52%) of respondents feel confident in their ability to find the cost of a procedure in advance. In fact,
among those who reported that they did not search for cost or quality information before a required
procedure, 28% reported that the act of looking for information felt confusing or overwhelming, and 24%
reported that they did not know where to look.
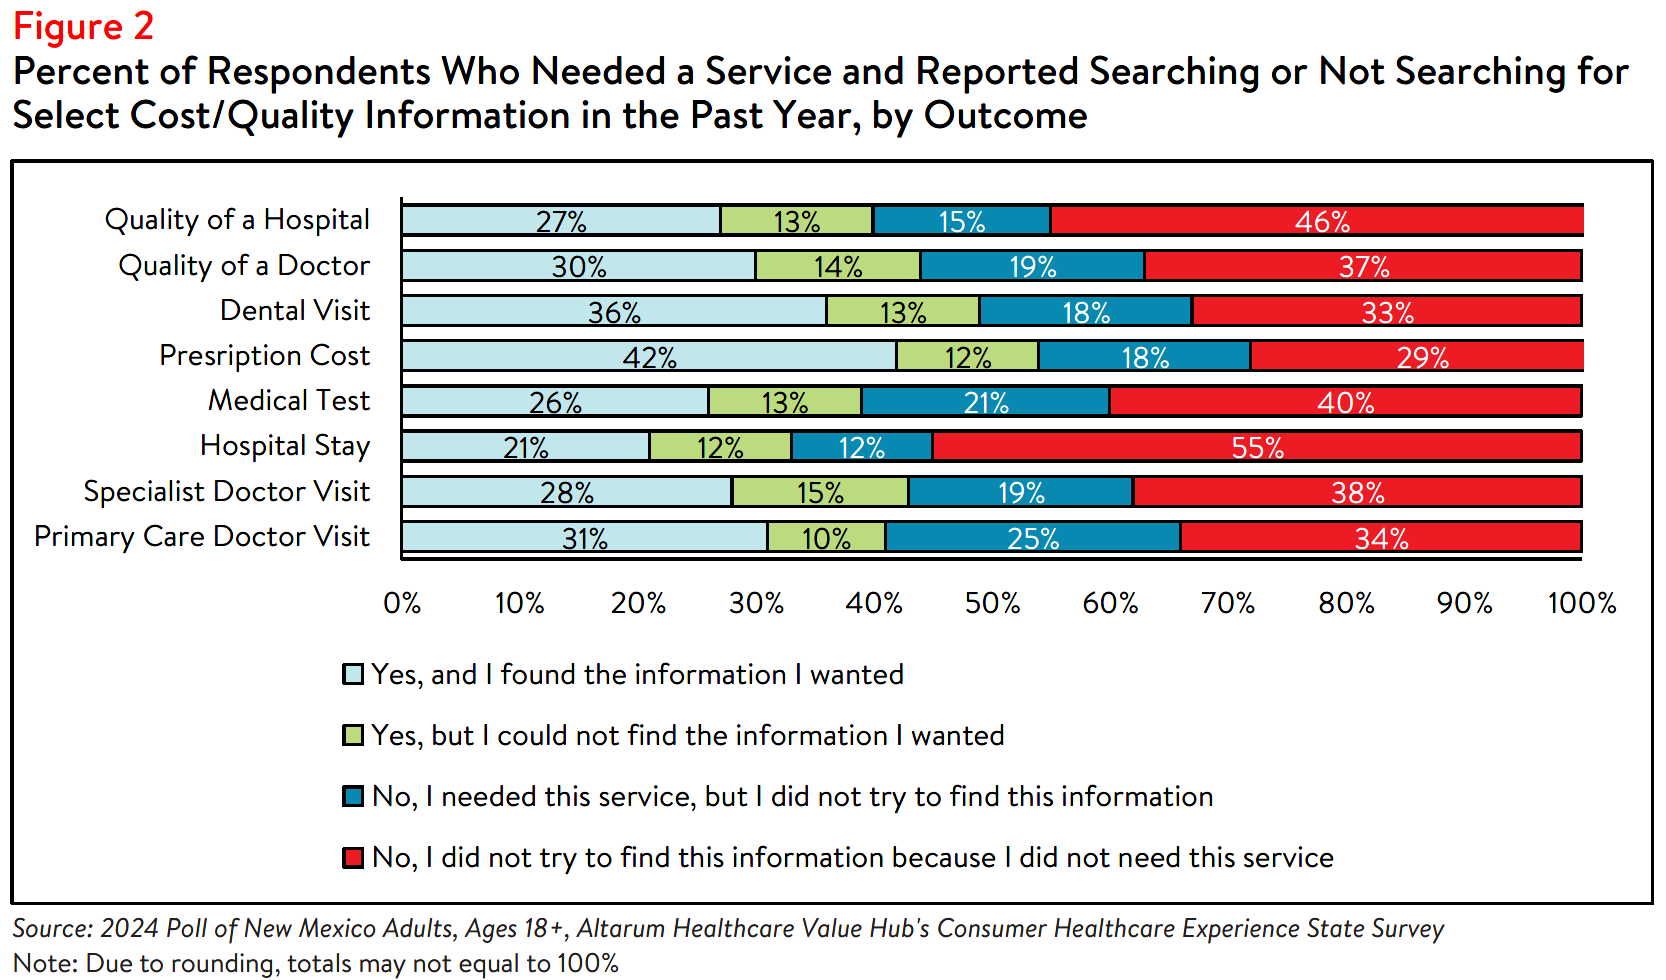
Although most respondents who searched for cost or quality information were successful, there were
some who reported that they were unable to find the information they needed (see Figure 2). Nearly half
(46%) of respondents who searched for, but could not find hospital cost information, reported that the
available cost information was confusing, 30% reported that their provider or hospital would not provide a
price estimate, 30% reported that their insurer would not provide a price estimate and 29% reported that
the price information was insufficient.
Likewise, among respondents who were unsuccessful in their search for hospital quality information, 30%
reported that the resources were confusing, and 23% reported that the quality information was not
sufficient. Notably, a small number of respondents reported that cost or quality is unimportant to them
(12 and 4%, respectively). These challenges persist despite federal hospital price transparency mandates.5
Research shows little correlation between the quality and the price of medical services.6 However, 44% of respondents reported that they would be willing to pay more to see a doctor with higher quality rankings. Additionally, 58% of New Mexico respondents reported that the out-of-pocket costs would a “very” or “extremely” important deciding factor if they had to choose between two providers with similar quality ratings. Likewise, 61% reported that quality ratings are an important factor when deciding between two physicians providing services for the same price.
Difficulty Understanding Common Health Care Terms
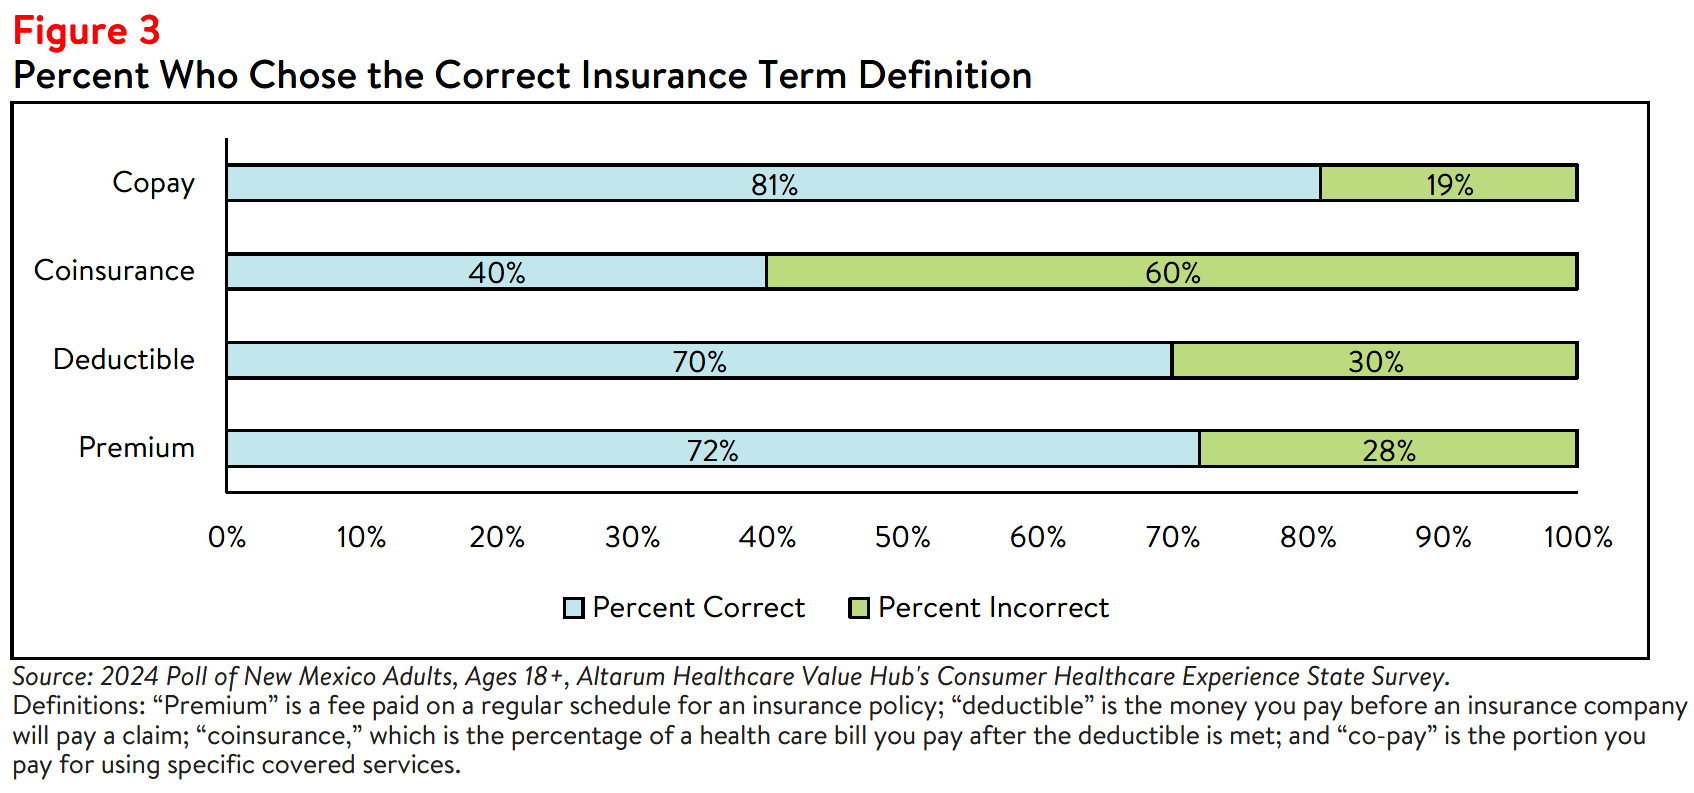
Research indicates that nearly half of insured adults find at least one aspect of their insurance difficult to
understand.7 When given multiple choices, three out of four (72% of) New Mexico respondents were able
to correctly define “premium,” and a similar amount (70%) were able to correctly define “deductible.”
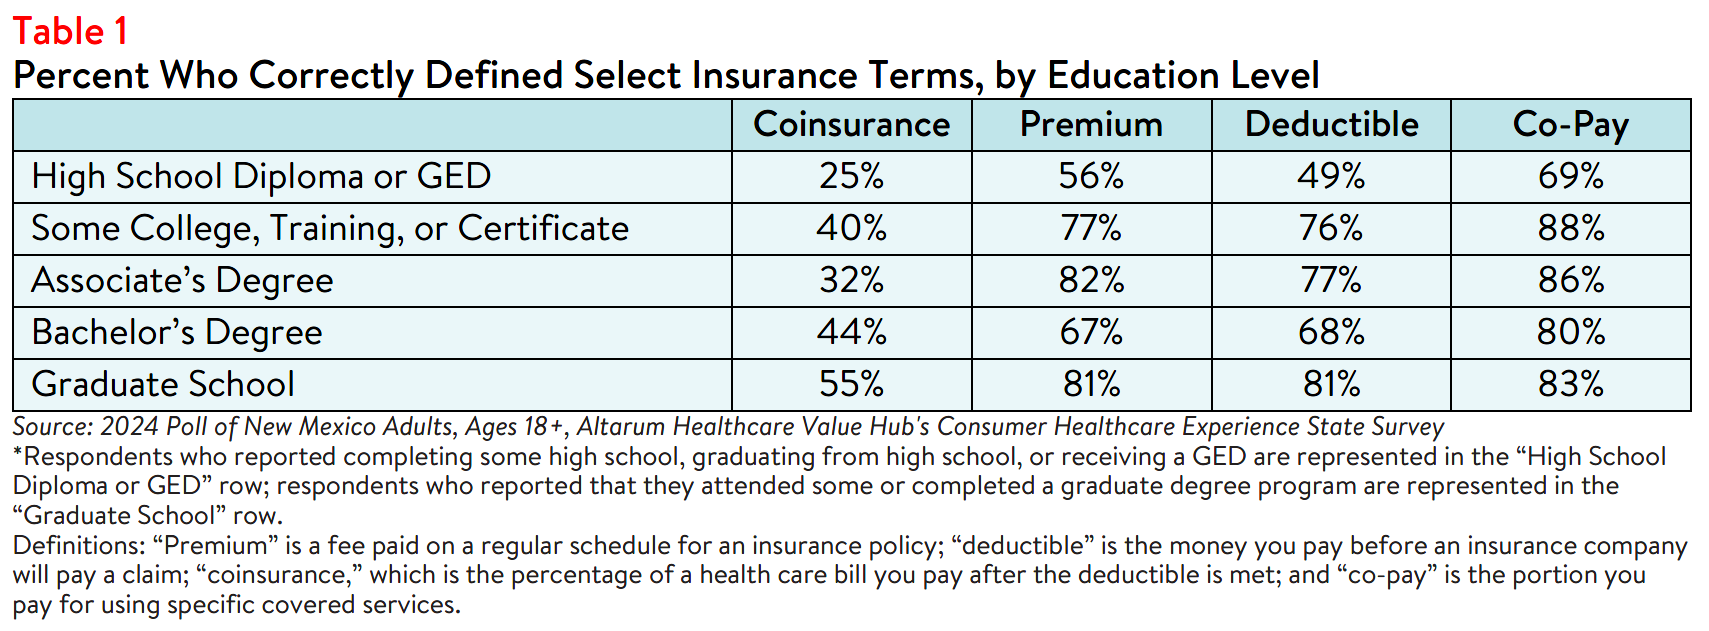
However, fewer than half (40%) were able to accurately define “coinsurance” (see Figure 3). Of note,
more educated respondents generally performed better when asked to define these terms (see Table 1).
Unexpected Medical Bills
Twenty-four percent of New Mexico respondents received a surprise medical bill in the past year. Among
those, respondents with employer-sponsored health insurance most frequently reported receiving a
surprise medical bill (33%), followed by respondents enrolled in Medicare coverage (27%), those who
purchase their own insurance (e.g., through the health care Marketplace) (22%); and respondents enrolled in New Mexico Medicaid program (19%).
When asked about the nature of their surprise medical bill, nearly half (44%) of respondents reported that
the amount was higher than anticipated, and 34% reported that the bill was from a provider that they
didn’t expect to receive a bill from. In smaller numbers, 12% reported being charged out-of-network rates
by a provider they believed was in-network, 5% reported being charged for services they did not receive
and 27% reported experiencing something else unexpected.
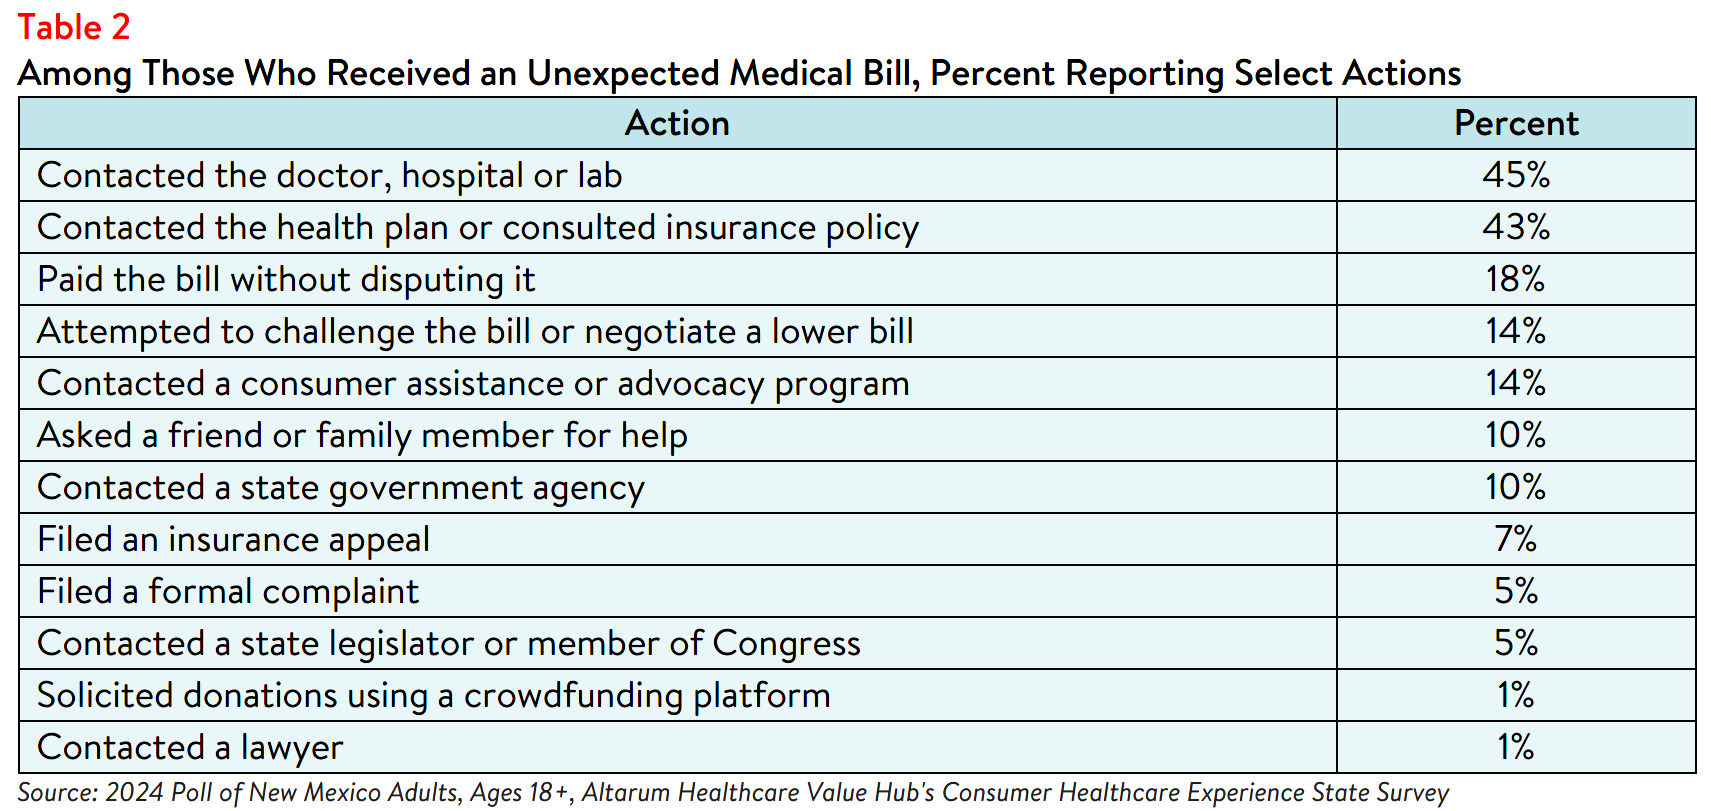
Beyond describing the nature of and/or reason the bill was unexpected, respondents also reported various attempts to resolve the issue. Of those who received an unexpected medical bill in the past year, over two out of five respondents (41%) took more than one step in their attempt to resolve their unexpected medical. Many contacted their health plan (43%) or provider (45%), some paid the bill without disputing it (18%), and few (7%) filed an insurance appeal (see Table 2).
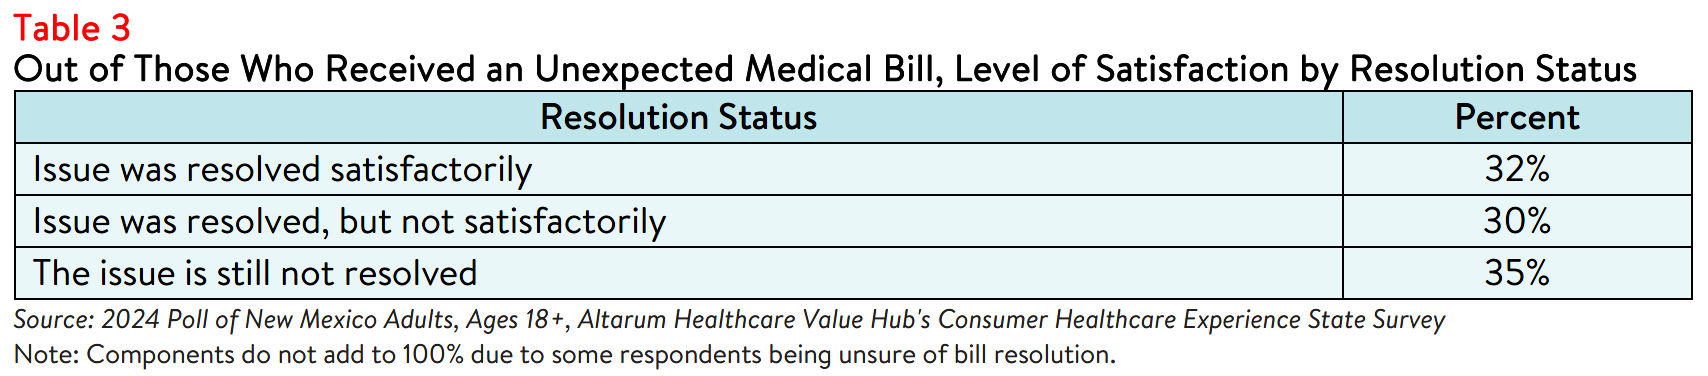
Only 32% of respondents with an unexpected medical bill indicated that the issue was resolved to their
satisfaction (see Table 3). Notably, satisfied respondents often reported employing more uncommon
resolution strategies, such as contacting a customer assistance program or consumer advocacy program,
whereas respondents who reported being dissatisfied with the resolution were more likely to have paid the
original bill without disputing.
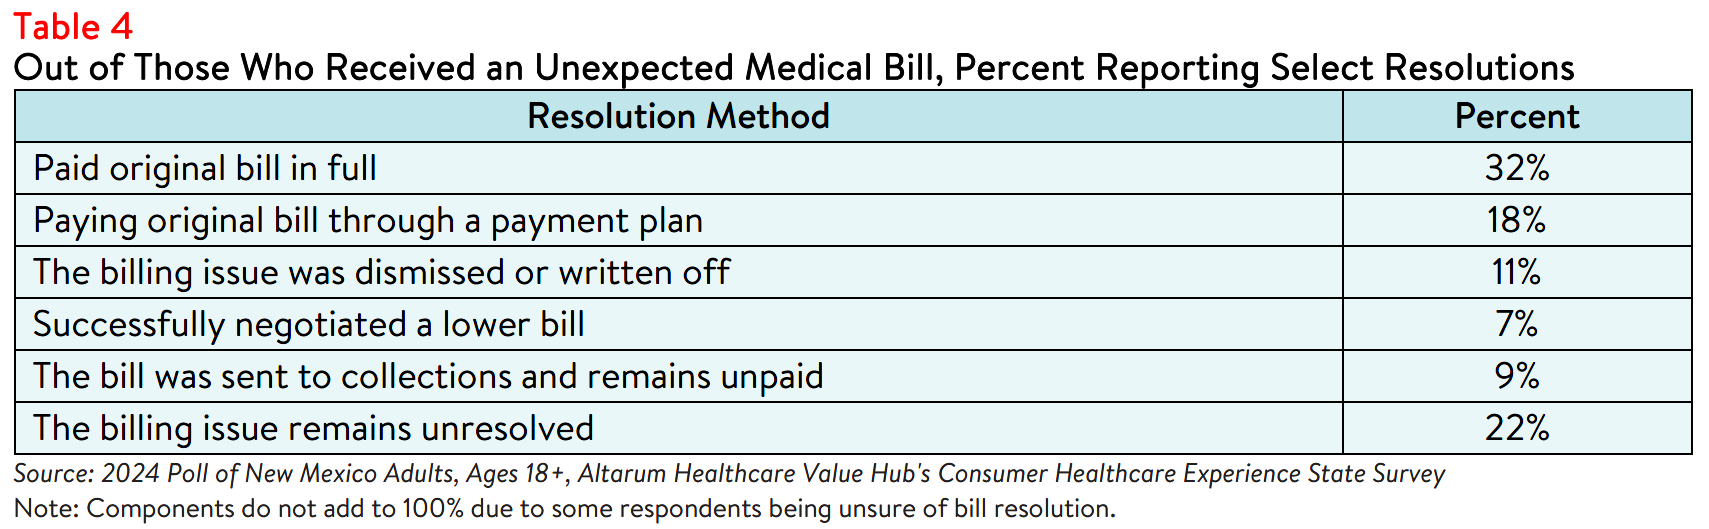
Regardless, the majority of respondents reported that they settled their bills by paying in full (32%) or
through a payment plan (18%), while a smaller number successfully negotiated a lower bill (7%) or had their bill dismissed (11%) (see Table 4). In a small number of cases (<1%), respondents reported filing for
bankruptcy due to an unexpected medical bill. Some respondents (9%) also reported the bill being sent to
a collections agency.8
Support for Solutions Across Party Lines
The burden of health care costs and the widespread support for reform indicate that elected leaders and
other stakeholders must prioritize addressing these consumer challenges. New Mexico respondents
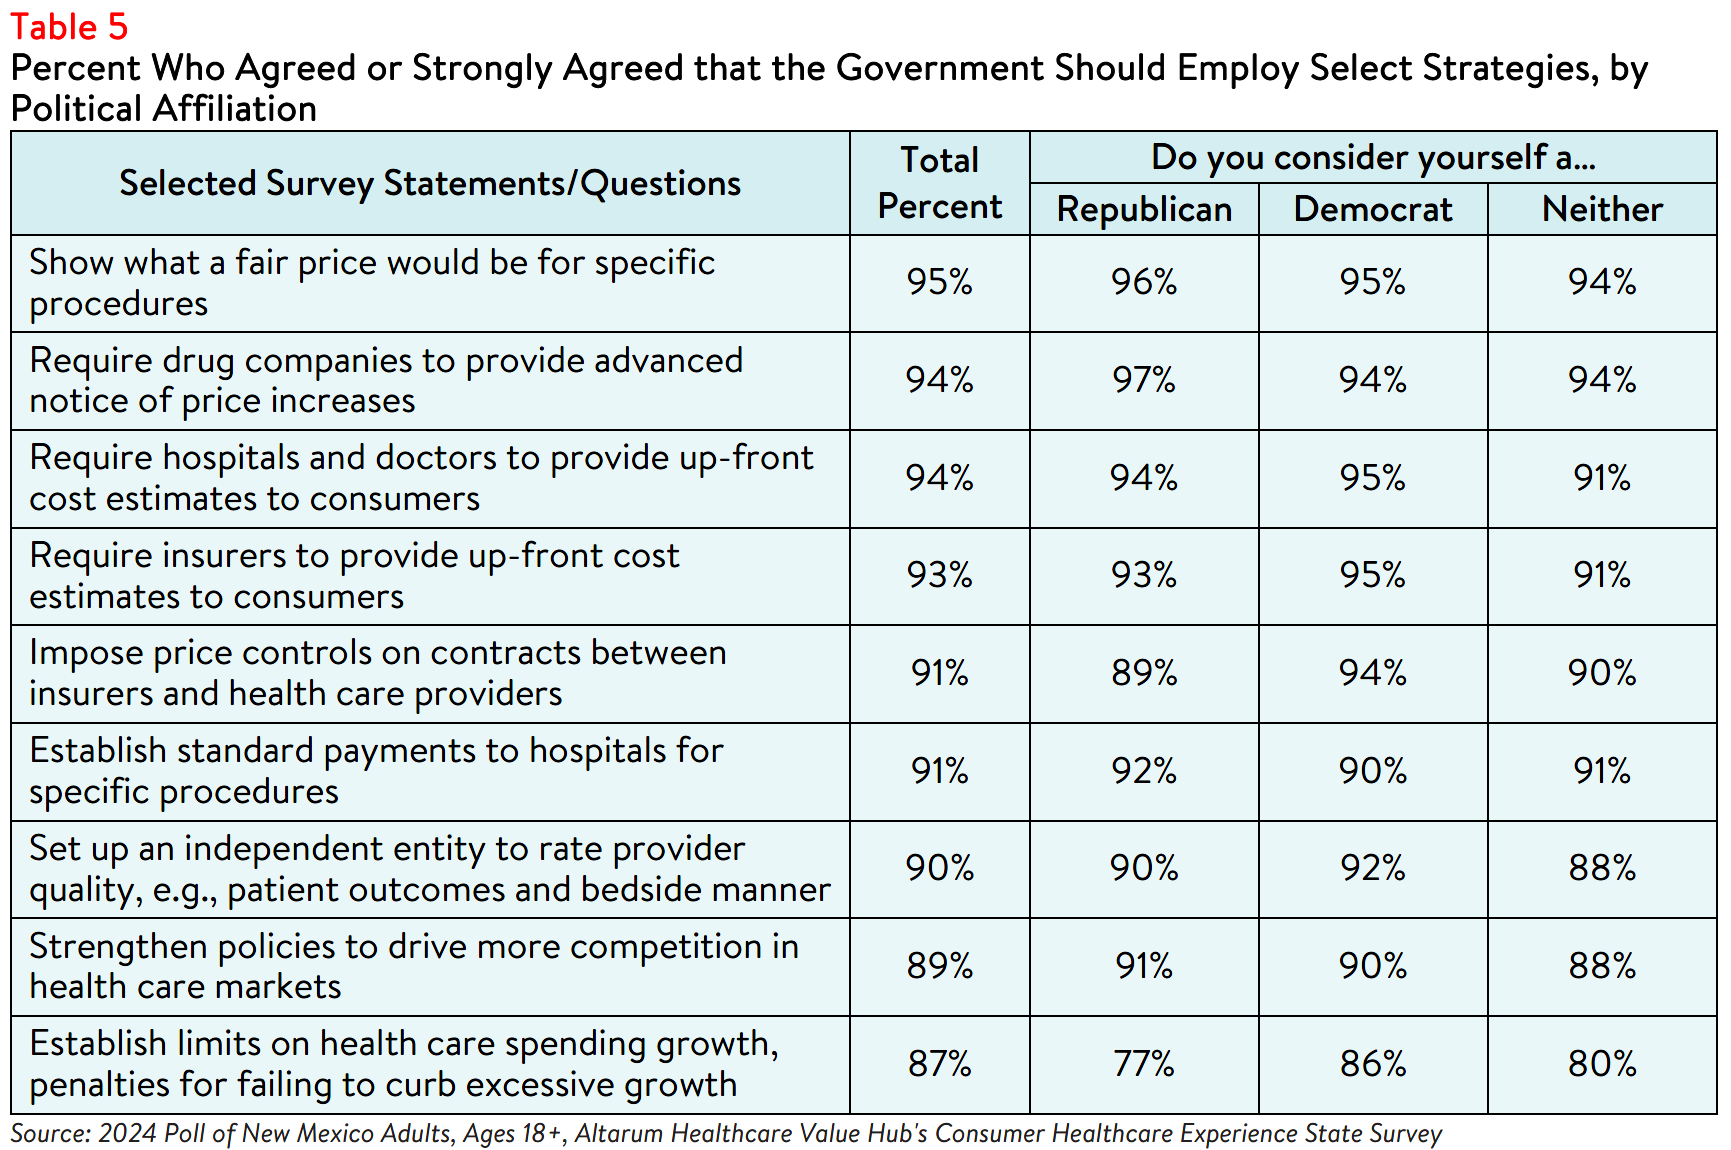
overwhelmingly endorsed several transparency-oriented strategies, including:
- 95%—Show what a fair price would be for specific procedures;
- 94%—Require drug companies to provide advanced notice of price increases;
- 94%—Require hospitals and doctors to provide up-front cost estimates to consumers;
- 93%—Require insurers to provide up-front cost estimates to consumers;
- 91%—Establish standard payments to hospitals for specific procedures;
- 91%—Impose price controls on contracts between insurers and health care providers;
- 90%—Set up an independent entity to rate doctor and hospital quality, such as patient outcomes and bedside manner;
- 89%—Strengthen policies to drive more competition in health care markets; and
- 87%—Establish limits on health care spending growth.
Support for these solutions extended across the aisle, reflecting bipartisan agreement on the need for
greater health care price transparency and policies designed to reduce the frequency of surprise medical
bills (see Table 5). It must be noted that, although price transparency tools can help identify unwarranted
price variation, these tools alone do not make markets more efficient and generally fail to encourage
consumers to shop for lower-priced services.9 Instead, policymakers should consider a combination of
transparency tools and evidence-based policies to effectively address these issues.
Conclusion
While New Mexico respondents report confidence in following their doctor's directions or filling
prescriptions, they are less confident in handling cost issues and resolving problems with providers, health plans, and hospitals. Furthermore, poor understanding of common terms can make it difficult to anticipate out-of-pocket costs and budget for health care expenses. These difficulties may contribute to unexpected medical bills, increased affordability burdens, and challenges in resolving bills satisfactorily. State legislators and advocates should consider a variety of interventions, including price transparency
resources and evidence-based policies, to improve health literacy, health insurance literacy and access to
comprehensive health care cost and quality information.
Notes
- A person's ability to seek, obtain, and understand health insurance plans, and once enrolled, use their insurance to seek appropriate health care services.
- A person’s ability to obtain, process, and understand basic health information and services needed to manage one’s health and make appropriate health decisions.
- Shahid, R., Shoker, M., Chu, L.M. et al. Impact of low health literacy on patients’ health outcomes: a multicenter cohort study. BMC Health Serv Res 22, 1148 (2022). https://doi.org/10.1186/s12913-022-08527-9
- According to Health Forum, an affiliate of the American Hospital Association, hospital adjusted expenses per inpatient day in New Mexico were $3,054 in 2022. See: Kaiser Family Foundation, State Health Facts Data: Hospital Adjusted Expenses per Inpatient Day, (Accessed July 26, 2024).
- As of January 1, 2021, the Centers for Medicare and Medicaid Services (CMS) requires hospitals to make public a
machine-readable file containing a list of standard charges for all items and services provided by the hospital, as well as a consumer-friendly display of at least 300 shoppable services that a patient can schedule in advance. However, Compliance from hospitals has been mixed, indicating that the rule has yet to demonstrate the desired effect. https://www.healthaffairs.org/content/forefront/hospital-price-transparency-progress-and-commitment-achieving-its-potential - "What Do We Know About Prices and Hospital Quality?", Health Affairs Blog, July 29, 2019.
https://www.healthaffairs.org/content/forefront/do-we-know-prices-and-hospital-quality (Accessed September 26,
2023). - Pollitz, K., Pestaina, K., Montero, A., Lopes, L., Valdes, I., Kirzinger, A., Brodie, M., KFF Survey of Consumer Experiences with Health Insurance, (KFF, June 15, 2024) https://www.kff.org/report-section/kff-survey-of-consumer-experiences-with-health-insurance-methodology/ (Accessed September 26, 2023).
- For more survey data on collections and medical debt, see: New Mexico Respondents Struggle to Afford High Healthcare Costs; Express Across Party Lines Support for a Range of Government Solutions, Healthcare Value Hub, August 2024
- Benavidez G, Frakt A. Price Transparency in Health Care Has Been Disappointing, but It Doesn’t Have to
Be. JAMA. 2019;322(13):1243–1244. https://jamanetwork.com/journals/jama/fullarticle/2752049 (Accessed on
September 26, 2024).
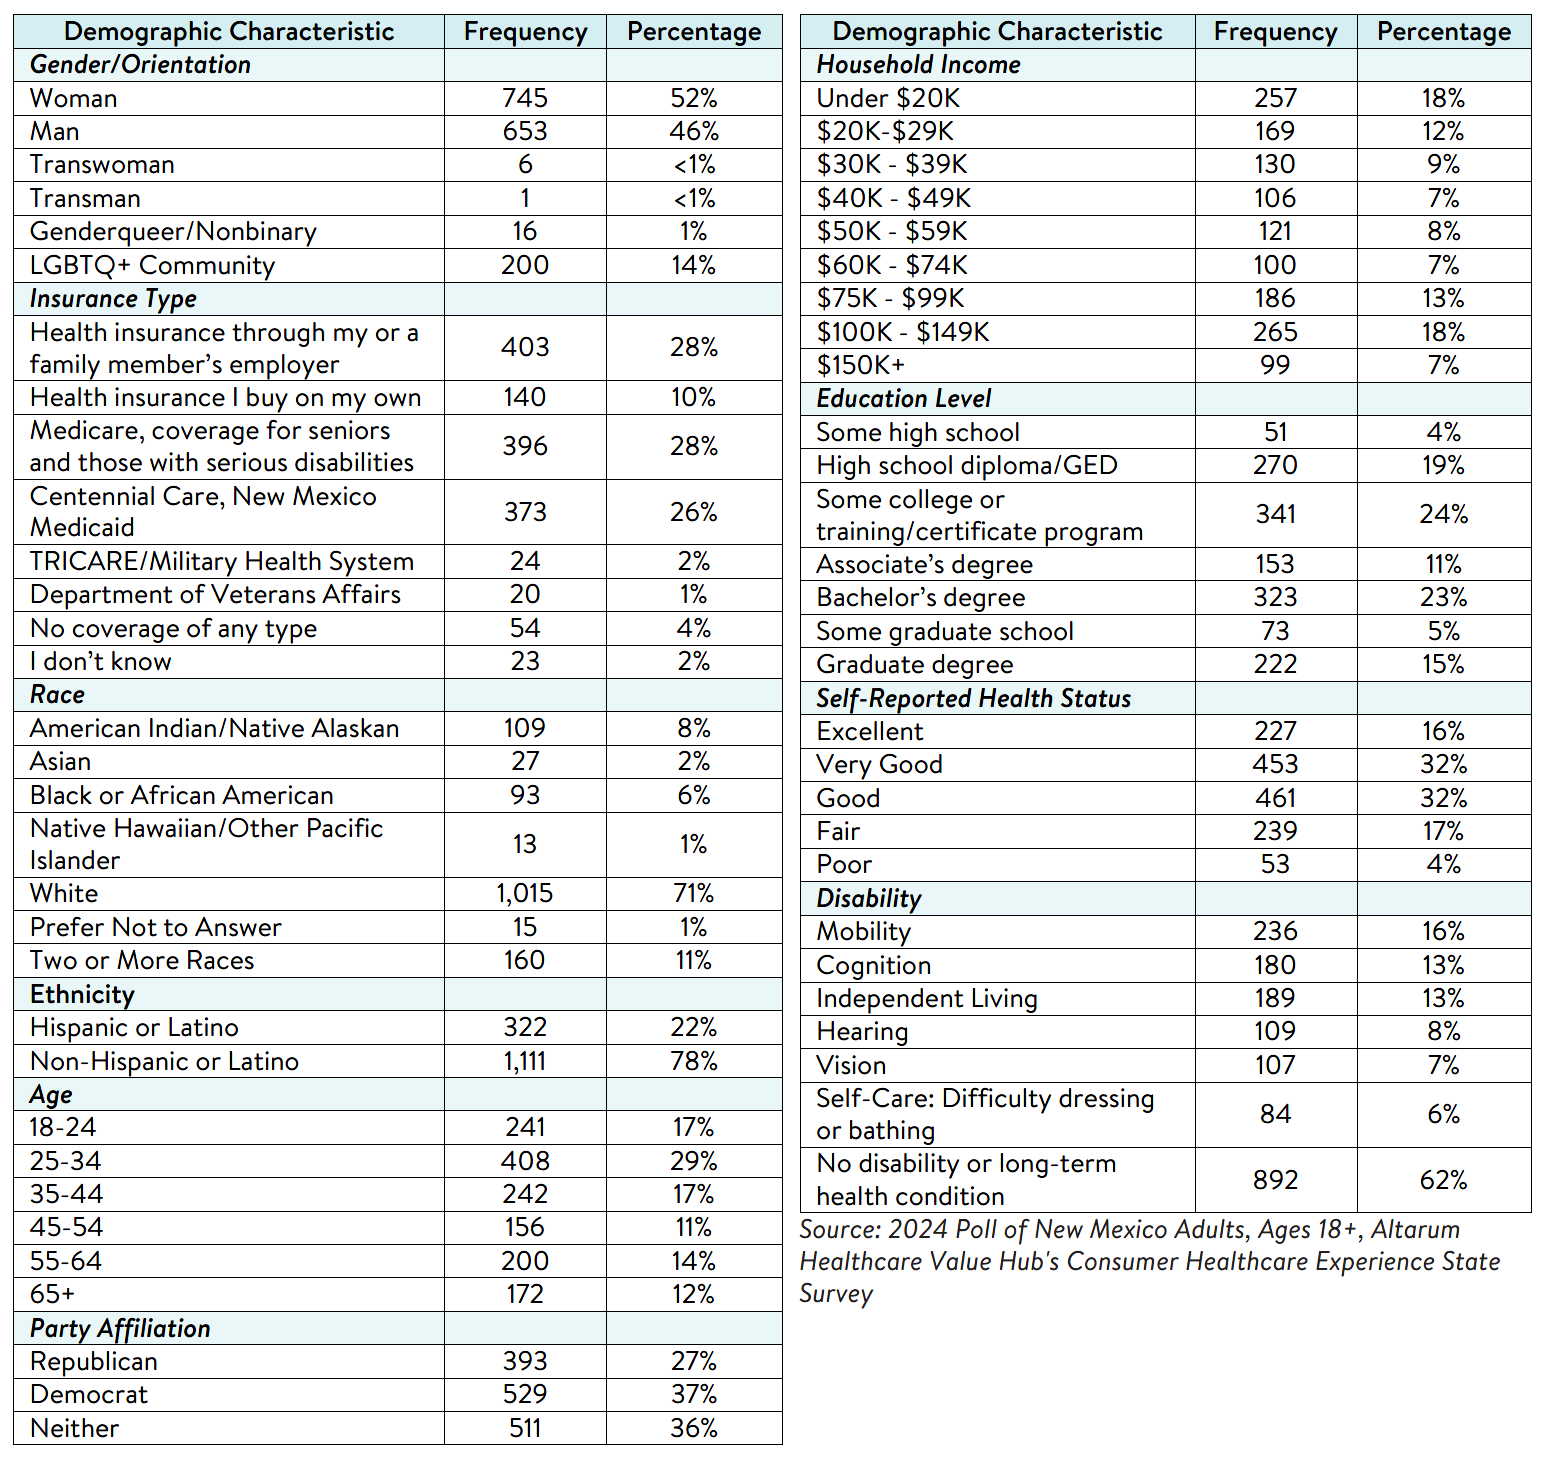
Methodology
Altarum’s Consumer Healthcare Experience State Survey (CHESS) is designed to elicit respondents’ views on a wide range of health system issues, including confidence using the health system, financial burden and possible policy solutions. This survey, conducted from June 6 to July 8, 2024, used a web panel from Dynata with a demographically balanced sample of approximately 1,500 respondents who live in New Mexico. Information about Dynata’s recruitment and compensation methods can be found
here. The survey was conducted in English or Spanish and restricted to adults ages 18 and older. Respondents who finished the survey in less than half the median time were excluded from the final sample, leaving 1,433 cases for analysis. After those exclusions, the demographic composition of respondents was as follows, although not all demographic information has complete response rates:

HEALTHCARE VALUE HUB
The Healthcare Value Hub can help you find free, timely information about policies and practices to achieve health systems that are equitable, affordable, and focused on the goals and needs of the people the system is meant to serve.
Share
![]()
![]()
![]()

Follow
![]()
![]()


![]()