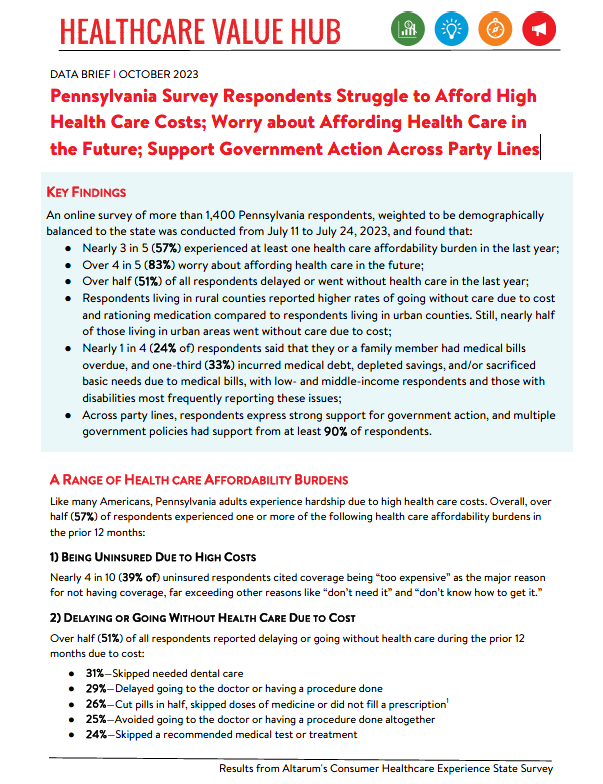
Pennsylvania Survey Respondents Struggle to Afford High Health Care Costs; Worry about Affording Health Care in the Future; Support Government Action Across Party Lines
Key Findings
An online survey of more than 1,400 Pennsylvania respondents, weighted to be demographically
balanced to the state was conducted from July 11 to July 24, 2023, and found that:
- Nearly 3 in 5 (57%) experienced at least one health care affordability burden in the last year;
- Over 4 in 5 (83%) worry about affording health care in the future;
- Over half (51%) of all respondents delayed or went without health care due to cost in the last year;
- Respondents living in rural counties reported higher rates of going without care due to cost and rationing medication compared to respondents living in urban counties. Still, nearly half of those living in urban areas went without care due to cost;
- Nearly 1 in 4 (24% of) respondents said that they or a family member had medical bills overdue, and one-third (33%) incurred medical debt, depleted savings, and/or sacrificed basic needs due to medical bills, with low- and middle-income respondents and those with disabilities most frequently reporting these issues;
- Across party lines, respondents express strong support for government action, and multiple government policies had support from at least 90% of respondents.
A Range of Healthcare Affordability Burdens
Like many Americans, Pennsylvania adults experience hardship due to high health care costs. Overall, over half (57%) of respondents experienced one or more of the following health care affordability burdens in the prior 12 months:
1) Being Uninsured Due to High Costs
Nearly 4 in 10 (39% of) uninsured respondents cited coverage being “too expensive” as the major reason
for not having coverage, far exceeding other reasons like “don’t need it” and “don’t know how to get it.”
2) Delaying or Going Without Healthcare Due to Cost
Over half (51%) of all respondents reported delaying or going without health care during the prior 12
months due to cost:
- 31%—Skipped needed dental care
- 29%—Delayed going to the doctor or having a procedure done
- 26%—Cut pills in half, skipped doses of medicine or did not fill a prescription1
- 25%—Avoided going to the doctor or having a procedure done altogether
- 24%—Skipped a recommended medical test or treatment
- 22%—Skipped needed vision services
- 17%—Had problems getting mental health care or addiction treatment
- 11%—Skipped needed hearing services
- 10%—Skipped or delayed getting a medical assistive device
Moreover, out of those who experienced a barrier to accessing care, respondents most frequently cited
cost as the reason for them or their family members not getting care in the last year (39%) followed by
not being able to get an appointment (37%), exceeding a host of other barriers like getting time off work
(21%), transportation barriers (19%), and lack of childcare (8%).
3) Struggling to Pay Medical Bills
Other times, respondents got the care they needed but struggled to pay the resulting bill. Overall, nearly 1
in 4 (24% of) respondents said that they or a family member have medical bills overdue, and one-third
(33%) of respondents reported experiencing one or more of these struggles to pay their medical bills:
- 15%—Were contacted by a collection agency
- 11%—Used up all or most of their savings
- 11%—Were unable to pay for basic necessities like food, heat or housing
- 9%—Racked up large amounts of credit card debt
- 8%—Borrowed money, got a loan or another mortgage on their home
- 7%—Were placed on a long-term payment plan
Of the various types of medical bills, the ones most frequently associated with an affordability barrier
were doctor bills, dental bills, and prescription drugs. The high prevalence of affordability burdens for
these services likely reflects the frequency with which Pennsylvania respondents seek these services. In
addition, trouble paying for dental bills likely reflects lower rates of coverage for these services (27% said
they were partially or completely without dental coverage in the past year).
High Levels of Worry About Affording Healthcare in the Future
Pennsylvania respondents also exhibit high levels of worry about affording health care in the future. Over
four in five (83%) reported being “worried” or “very worried” about affording some aspect of health care
in the future, including:
- 68%—Cost of nursing home or home care services
- 64%—Medical costs when elderly
- 62%—Health insurance will become unaffordable
- 61%—Medical costs in the event of a serious illness or accident
- 55%—Prescription drugs will become unaffordable
- 53%—Cost of dental care
- 48%—Cost of needed vision services
- 47%—Cost of needed hearing services
While two of the most common worries—affording the cost of nursing home or home care services and
medical costs when elderly—are applicable predominantly to an older population, they were most
frequently reported by respondents ages 25-54. This finding suggests that Pennsylvania respondents may
be worried about affording the cost of care for both aging relatives and themselves.
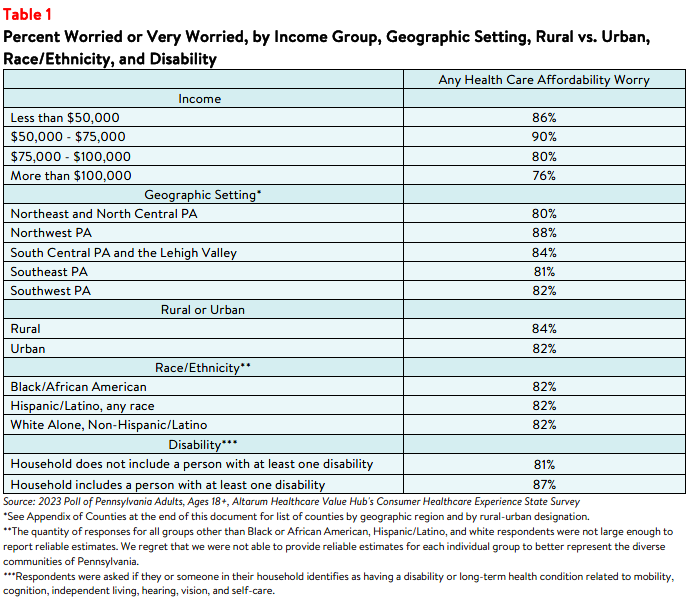
Worry about affording health care was highest among respondents living in low- and middle-income
households, among those living in households with a person with a disability, and those living in Northwest Pennsylvania (see Table 1). Overall, 86% of respondents with household incomes less than $50,000 a year reported worrying about affording some aspect of coverage or care in the past year, as did 90% of those earning $50,000 to $75,000 per year.2 Still, most Pennsylvania respondents of all incomes, races, ethnicities, geographic setting, and levels of ability were somewhat or very concerned.
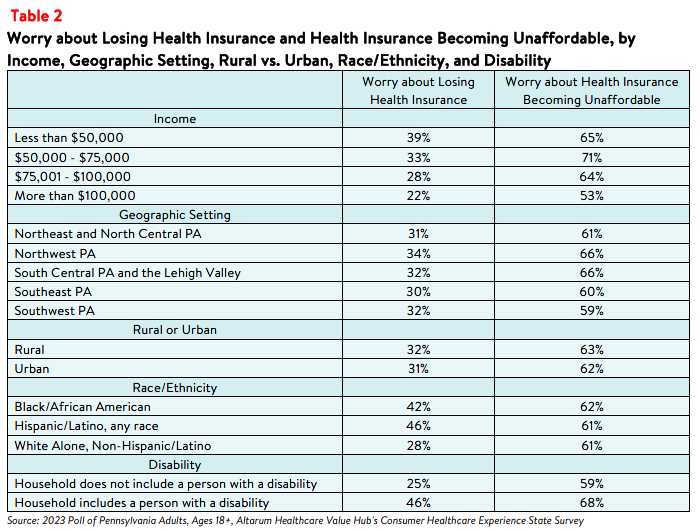
Concern that health insurance will become unaffordable is also more prevalent among certain groups of
Pennsylvania respondents. Respondents with household incomes below $50,000 per year reported the
highest rates of worry about losing coverage, while those earning $50,000 to $75,000 reported the
highest rates of worry about not being able to afford coverage in the future (see Table 2). Respondents
living in households with a person with a disability reported higher rates of being concerned about losing
health insurance than those living in a household without a person with a disability. Respondents living in Northwest PA and South Central PA and the Lehigh Valley reported the highest rate of worry about
affording insurance in the future compared to residents in other geographic areas.
Concerns about affording coverage exceeded fears about losing coverage across all income groups,
disability statuses, geographic settings, and race/ethnicity groups.
Differences in Healthcare Affordability Burdens
The survey also revealed differences in how Pennsylvania respondents experience health care affordability burdens by income, geographic setting, race/ethnicity, and disability.
Income
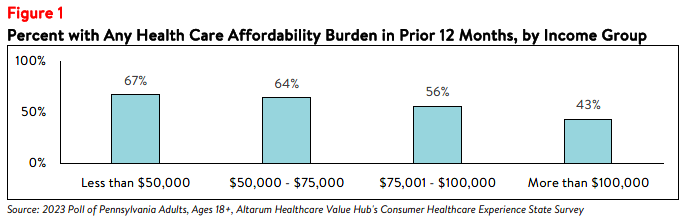
Unsurprisingly, respondents at the lowest end of the income spectrum most frequently reported
experiencing one or more health care affordability burdens, with roughly two-thirds (67%) of those
earning less than $50,000 per year reporting struggling to afford some aspect of coverage or care in the
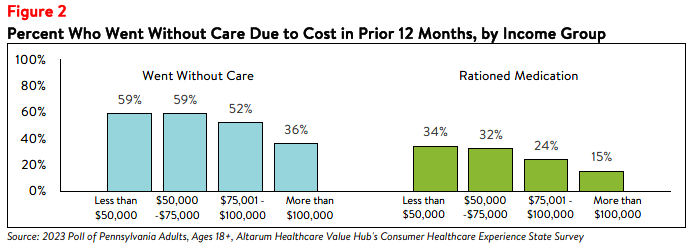
past 12 months, as did 64% of those earning $50,000 - $75,000 (see Figure 1). This may be due, in part, to respondents in this income group reporting higher rates of going without care and rationing their
medication due to cost (see Figure 2).
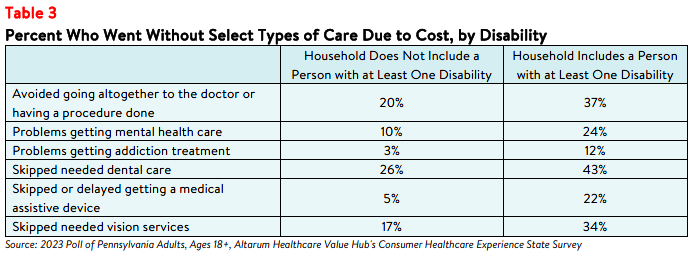
Disability
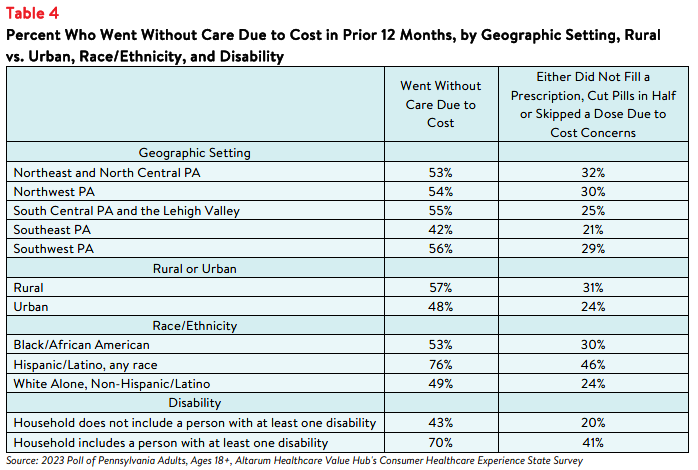
Respondents living in households with a person with a disability reported the highest rates of going
without care and rationing medication due to cost in the past 12 months. Seven in ten (70% of)
respondents in this group reported going without some form of care and 41% reported rationing
medication, compared to 43% and 20% of respondents living in households without a person with a
disability, respectively (see Table 4). Respondents living in households with a person with a disability also
more frequently reported delaying or skipping getting mental health care, addiction treatment, and dental
care, than those in households without a person with a disability due to cost concerns (see Table 3).
Those with disabilities also face health care affordability burdens unique to their disabilities—22% of
respondents with a disabled household member reported delaying getting a medical assistive device such
as a wheelchair, cane/walker, hearing aid, or prosthetic limb due to cost. Just 5% of respondents without a
person with a disability in their household (who may have needed such tools temporarily or may not
identify as having a disability) reported this experience.
Geographic Area and Rural vs. Urban
Respondents living in rural counties reported higher rates of going without care due to cost and rationing
medication compared to respondents living in urban counties. Overall, 57% of those in rural areas went
without care due to cost compared to 48% of those living in urban areas (see Table 4). Further analysis
found that rationing medication due to cost was most frequently reported among respondents in
Northwest and North Central PA, Northwest PA, and Southwest PA.
Race and Ethnicity
Overall, fifty-three percent of Black or African American respondents and 76% of Hispanic/Latino
respondents reported going without care due to cost in the past twelve months compared to 49% of
white alone, non-Hispanic/Latino respondents (see Table 4). Further analysis showed that Black or African
American and Hispanic/Latino respondents reported higher rates of challenges receiving mental health
care and skipping needed dental care compared to White alone, non-Hispanic/Latino respondents, and
Hispanic/Latino respondents had the highest rates of going without care across multiple care types
compared to other groups.
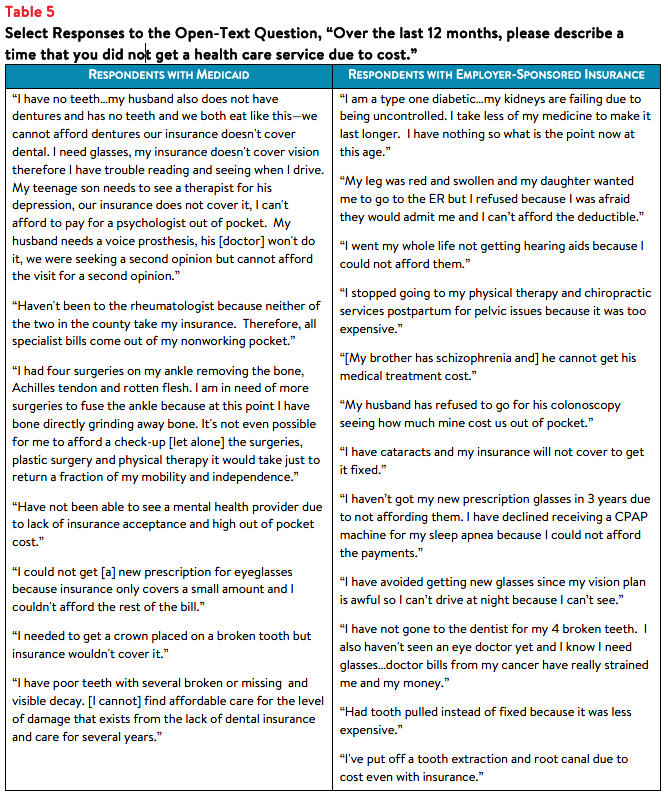
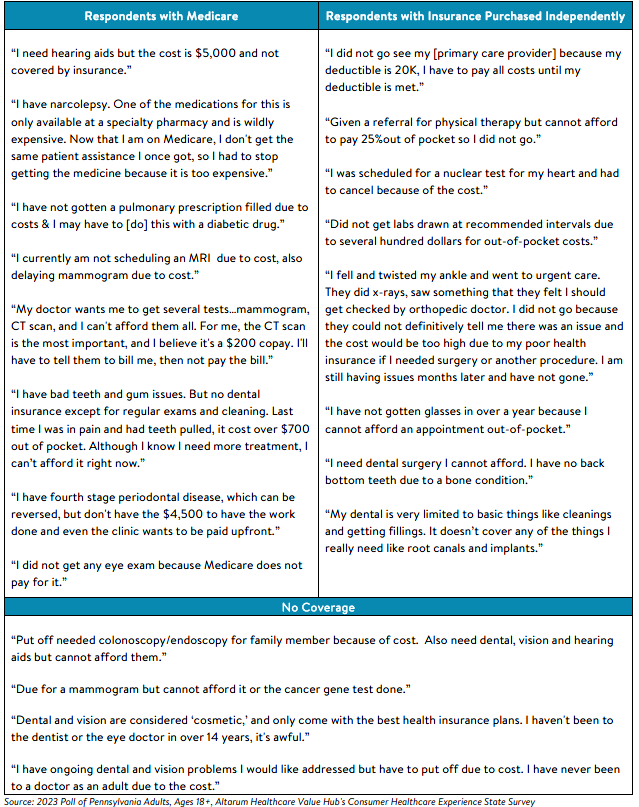
Insurance Type
Survey respondents also had the opportunity to share their own stories about going without care due to
cost in the past year. Notably, respondents with both private insurance and Medicaid coverage reported
challenges affording care (see Table 5).
Encountering Medical Debt
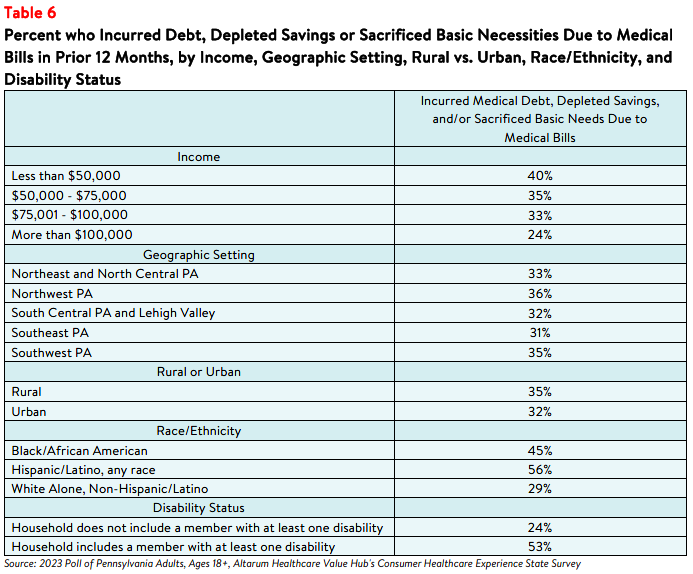
The survey also showed differences in the prevalence of financial burdens due to medical bills, including
going into medical debt, depleting savings, and being unable to pay for basic necessities (like food, heat,
and housing) by income, race, ethnicity, disability status, and geographic setting. Forty-five percent of
Black or African American respondents and 56% of Hispanic/Latino respondents reported going into debt,
depleting savings, or going without other needs due to medical bills, compared to 29% of white alone,
non-Hispanic/Latino respondents (see Table 6).
The rate of financial burden is even higher for respondents who have or live with a person with a disability,
with over one-half (53%) reporting going into debt or going without other needs due to medical bills,
compared to 24% of respondents without a disabled household member. Geographically, residents in
Northwest and Southwest Pennsylvania reported higher rates of going into debt or going without other
needs due to medical bills, although all geographic groups reported somewhat similar levels. In addition,
respondents earning less than $50,000 per year reported the highest rate of the above financial burdens
due to medical bills (40%) compared to respondents with higher incomes.
Impact and Worry Related to Hospital Consolidation*
In addition to the above health care affordability burdens, a small share of Pennsylvania respondents were negatively impacted by health system consolidation. In the past year, 32% of all respondents were aware of a merger or acquisition in their community, and 12% of those respondents reported that they or a
family member were unable to access their preferred health care organization because of a merger that
made their preferred organization out-of-network. Out of those who reported being unable to access
their preferred health care provider due to a merger:
- 52% skipped recommended follow-up visits due to a merger,
- 45% delayed or avoided going to the doctor or having a procedure done because they could no longer access their preferred health care organization due to a merger,
- 24% skipped filling a prescription medication due to a merger.
Out of those who reported that the merger caused an additional burden for them or their families, the top
three most frequently reported issues were:
- 34%—The merger created an added wait time when searching for a new provider
- 23%—The merger created an added financial burden
- 15%—The merger created a hard time finding a new provider they trust or respect
While a small portion of respondents reported being unable to access their preferred health care
organization because of a merger, far more respondents (58%) reported that, if mergers or acquisitions
were happening in their community, they would be somewhat, moderately or very worried. When asked
about their largest concern respondents most frequently reported:
- 27%—I’m concerned I will have fewer choices of where to receive care
- 27%—I’m concerned my doctor may no longer be covered by my insurance
- 20%—I’m concerned I will have to pay more to see my doctor
- 15%—I’m concerned I will have to travel farther to see my doctor
- 12%—I’m concerned I will have a lower quality of care
*Note: The sample size of respondents who said they were affected by a merger was not large enough to report reliable estimates, so the values in this section should be interpreted with caution.
Dissatisfaction with the Health System and Support for Change
In light of Pennsylvania respondents’ health care affordability burdens and concerns, it is not surprising
that they are dissatisfied with the health system:
- Just 29% agreed or strongly agreed that “we have a great health care system in the U.S.,”
- While 72% agreed or strongly agreed that “the system needs to change."
To investigate further, the survey asked about both personal and governmental actions to address health
system problems.
Personal Actions
Pennsylvania respondents see a role for themselves in addressing health care affordability. When asked
about specific actions they could take or have taken:
- 54% of respondents reported researching the cost of a prescription drug beforehand;
- 79% said they would be willing to switch from a brand name to an equivalent generic drug;
- 39% of respondents researched the cost of a primary care doctor visit ahead of time; and
- 34% researched the cost of a medical test beforehand.
When asked to select the top three personal actions they felt would be most effective in
addressing health care affordability (out of ten options), the most common responses were:
- 69%—Take better care of my personal health
- 42%—Research treatments myself before going to the doctor
- 30%—Do more to compare doctors on cost and quality before getting services
- 25%—Write to or call my state representative asking them to take action on high healthcare prices and lack of affordable coverage options
- 24%—There is not anything I can do personally to make our health system better
Government Actions
But far and away, Pennsylvania respondents see government as the key stakeholder that needs to act to
address health system problems. Moreover, addressing health care problems is one of the top priorities
that respondents want their elected officials to work on.
At the beginning of the survey, respondents were asked the top 3 issues the government should address
in the upcoming year. The top vote getters were:
- 51%—Economy/Joblessness
- 48%—Health care
- 38%—Taxes
- 29%—Environment
- 26%—Affordable housing
- 17%—Cost of higher education
When asked about the top three health care priorities the government should work on, the top vote
getters were:
- 52%—Address high health care costs, including prescription drugs
- 37%—Get health insurance to those who cannot afford coverage
- 36%—Improve Medicare, coverage for seniors and those with serious disabilities
- 32%—Preserve consumer protections preventing people from being denied coverage or charged more for having a pre-existing medical condition
Of more than 20 options, Pennsylvania respondents believe the reason for high health care costs is unfair
prices charged by powerful industry stakeholders:
- 74%—Drug companies charging too much money
- 73%—Hospitals charging too much money
- 70%—Insurance companies charging too much money
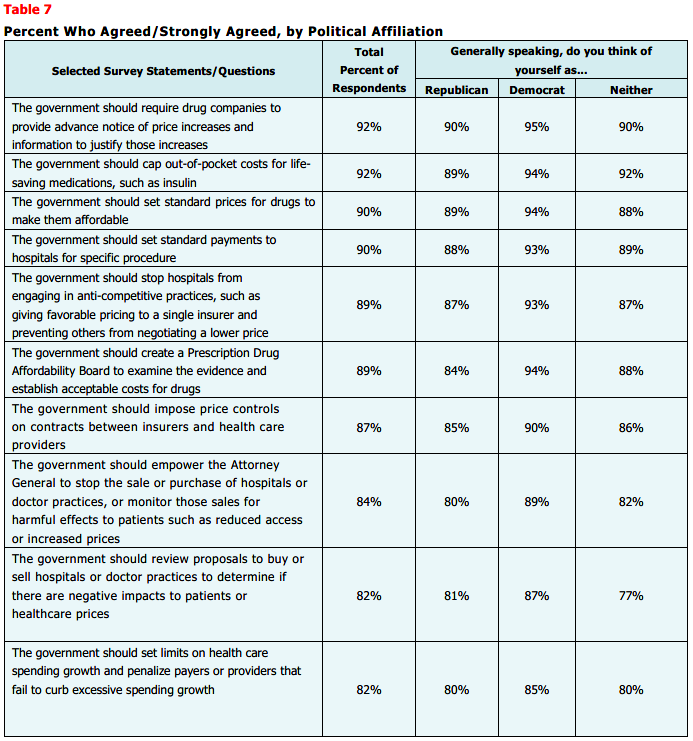
When it comes to tackling costs, respondents endorsed a number of strategies, including:
- 92%—Cap out-of-pocket costs for life-saving medications, such as insulin
- 92%—Require drug companies to provide advanced notice of price increases and information to justify those increases
- 90%—Set standard prices for prescription drugs to make them affordable
- 90%—Set standard payments to hospitals for specific procedures
- 89%—Create a Prescription Drug Affordability Board to examine the evidence and establish acceptable costs for drugs
- 89%—Stop hospitals from engaging in anti-competitive practices, such as giving favorable pricing to a single insurer and preventing others from negotiating a lower price
- 84%—Empower the Attorney General to stop the sale or purchase of hospitals or doctor practices, or monitor those sales for harmful effects to patients such as reduced access or increased prices
Support for Action Across Party Lines
There is also remarkable support for change regardless of respondents' political affiliation (see Table 7).
The high burden of health care affordability, along with high levels of support for change, suggest that
elected leaders and other stakeholders need to make addressing this consumer burden a top priority.
Moreover, the last several years have led state residents to take a hard look at how well health systems are working for them, with strong support for a wide variety of actions. Annual surveys can help
assess whether progress is being made.
Notes
- Twenty-one percent (21%) did not fill a prescription and 16% cut pills in half or skipped doses of medicine due to cost.
- Median household income in Pennsylvania was $67,587 (2017-2021). U.S. Census, Quick Facts. Retrieved from: U.S.Census Bureau QuickFacts, https://www.census.gov/quickfacts/fact/
Appendix of Counties
Geographic Setting
Northeast and North Central PA: Bradford, Carbon, Centre, Clinton, Columbia, Juniata, Lackawanna, Luzerne, Lycoming, Mifflin, Monroe, Montour, Northumberland, Pike, Schuylkill, Snyder, Sullivan, Susquehanna, Tioga, Union, Wayne, Wyoming
Northwest PA: Cameron, Clarion, Clearfield, Crawford, Elk, Erie, Forest, Jefferson, McKean, Mercer, Potter, Venango, Warren
South Central PA and the Lehigh Valley: Adams, Berks, Cumberland, Dauphin, Franklin, Fulton, Huntingdon, Lancaster, Lebanon, Lehigh, Northampton, Perry, York
Southeast PA: Bucks, Chester, Delaware, Montgomery, Philadelphia
Southwest PA: Allegheny, Armstrong, Beaver, Bedford, Blair, Butler, Cambria, Fayette, Greene, Indiana, Lawrence, Somerset, Washington, Westmoreland
Rural-Urban Designation
Rural: Adams, Armstrong, Bedford, Blair, Bradford, Butler, Cambria, Cameron, Carbon, Centre, Clarion, Clearfield, Clinton, Columbia, Crawford, Elk, Fayette, Forest, Franklin, Fulton, Greene, Huntingdon, Indiana, Jefferson, Juniata, Lawrence, Lycoming, Mckean, Mercer, Mifflin, Monroe, Montour, Northumberland, Perry, Pike, Potter, Schuylkill, Snyder, Somerset, Sullivan, Susquehanna, Tioga, Union, Venango, Warren, Washington, Wayne, Wyoming
Urban: Allegheny, Beaver, Berks, Bucks, Chester, Cumberland, Dauphin, Delaware, Erie, Lackawanna, Lancaster, Lebanon, Lehigh, Luzerne, Montgomery, Northampton, Philadelphia, Westmoreland, York
Methodology
Altarum’s Consumer Healthcare Experience State Survey (CHESS) is designed to elicit respondents’ unbiased views on a wide range of health system issues, including confidence using the health system, financial burden, and views on fixes that might be needed.
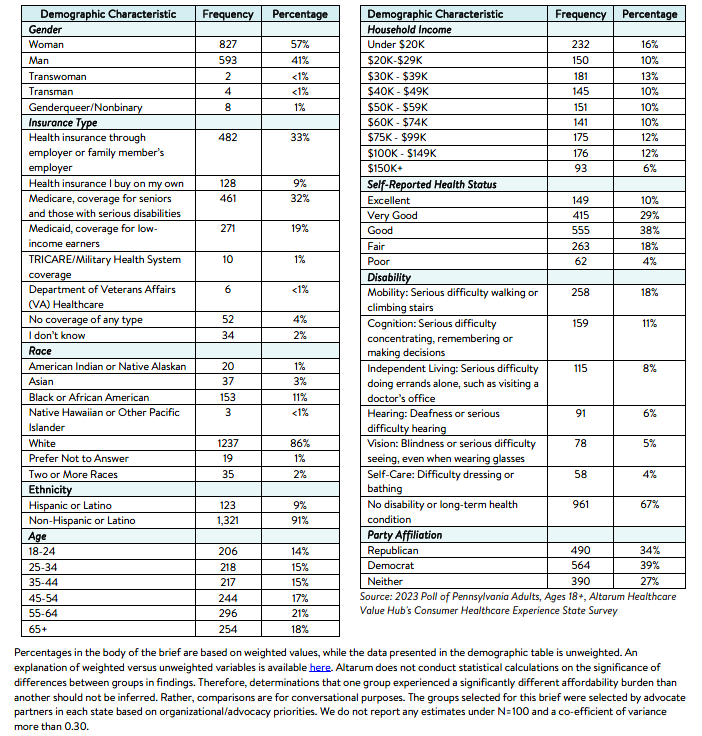
This survey, conducted from July 11 to July 24, 2023, used a web panel from online survey company Dynata with a approximately 1,500 respondents who live in Pennsylvania. Data was cleaned and weighted to the appropriate demographic balance of the state. While this survey is not generalizable to the entire state, it does allow for important insights into a balanced sample of adults in Pennsylvania. Information about Dynata’s recruitment and compensation methods can be found here. The survey was conducted in English or Spanish and restricted to adults ages 18 and older. Respondents who finished the survey in less than half the median time were excluded from the final sample, leaving 1,444 cases for analysis. After those exclusions, the demographic composition of respondents was as follows, although not all demographic information has complete response rates:

Pennsylvania Survey Reports
2023
Statewide Reports
Prescription Drug Affordability
2021
Statewide Reports
Prescription Drug Affordability
2018
Statewide Reports
Regional Reports
Northeast/North Central Region
South Central/Lehigh Valley Region
Report Download
|
HEALTHCARE VALUE HUB
The Healthcare Value Hub can help you find free, timely information about policies and practices to achieve health systems that are equitable, affordable, and focused on the goals and needs of the people the system is meant to serve.
Share
![]()
![]()
![]()

Follow
![]()
![]()


![]()