West Virginia and Surrounding Appalachian Counties Residents Struggle to Afford High Healthcare Costs; Worry about Affording Healthcare in the Future; Support Government Action across Party Lines
Key Findings
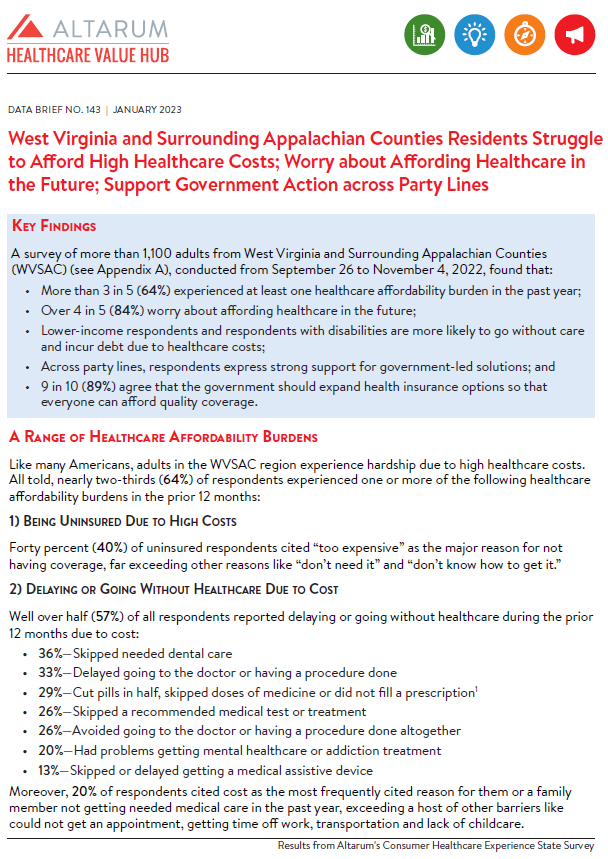
A survey of more than 1,100 adults from West Virginia and Surrounding Appalachian Counties (WVSAC) (see Appendix A), conducted from September 26 to November 4, 2022, found that:
- More than 3 in 5 (64%) experienced at least one healthcare affordability burden in the past year;
- Over 4 in 5 (84%) worry about affording healthcare in the future;
- Lower-income respondents and respondents with disabilities are more likely to go without care and incur debt due to healthcare costs;
- Across party lines, respondents express strong support for government-led solutions; and
- 9 in 10 (89%) agree that the government should expand health insurance options so that everyone can afford quality coverage.
A Range of Healthcare Affordability Burdens
Like many Americans, adults in the WVSAC region experience hardship due to high healthcare costs. All told, nearly two-thirds (64%) of respondents experienced one or more of the following healthcare affordability burdens in the prior 12 months:
1) Being Uninsured Due to High Costs
Forty percent (40%) of uninsured respondents cited “too expensive” as the major reason for not having coverage, far exceeding other reasons like “don’t need it” and “don’t know how to get it.”
2) Delaying or Going Without Healthcare Due to Cost
Well over half (57%) of all respondents reported delaying or going without healthcare during the prior 12 months due to cost:
- 36%—Skipped needed dental care
- 33%—Delayed going to the doctor or having a procedure done
- 29%—Cut pills in half, skipped doses of medicine or did not fill a prescription1
- 26%—Skipped a recommended medical test or treatment
- 26%—Avoided going to the doctor or having a procedure done altogether
- 20%—Had problems getting mental healthcare or addiction treatment
- 13%—Skipped or delayed getting a medical assistive device
Moreover, 20% of respondents cited cost as the most frequently cited reason for them or a family member not getting needed medical care in the past year, exceeding a host of other barriers like could not get an appointment, getting time off work, transportation and lack of childcare.
3) Struggling to Pay Medical Bills
Other times, respondents got the care they needed but struggled to pay the resulting bill. All told, two
in five (41%) experienced one or more of these struggles to pay their medical bills:
- 18%—Used up all or most of their savings
- 17%—Were contacted by a collection agency
- 14%—Were unable to pay for basic necessities like food, heat or housing
- 10%—Racked up large amounts of credit card debt
- 10%—Borrowed money, got a loan or another mortgage on their home
- 8%—Were placed on a long-term payment plan
Of the various types of medical bills, the ones most frequently associated with an affordability barrier
were dental bills, doctor bills and prescription drugs. The high prevalence of affordability burdens for
these services likely reflects the frequency with which the respondents in the WVSAC region seek
these services. Trouble paying for dental bills likely reflects lower rates of coverage for these services.
High Levels of Worry About Affording Healthcare in the Future
WVSAC Region respondents also exhibit high levels of worry about affording healthcare in the
future. Four in five (84%) reported being “worried” or “very worried” about affording some aspect of
healthcare in the future, including:
- 67%—Cost of nursing home or home care services
- 63%—Medical costs when elderly
- 62%—Health insurance will become unaffordable
- 62%—Medical costs in the event of a serious illness or accident
- 58%—Cost of dental care
- 56%—Prescription drugs will become unaffordable
- 34%—Cost of treatment for coronavirus/COVID-19
While two of the most common worries—affording the cost of nursing home or home care services
and medical costs when elderly—are applicable predominantly to an older population, they were
most frequently reported by respondents ages 35-54. This finding suggests that WVSAC Region
respondents may be worried about affording the cost of care for both aging parents and themselves.
Worry about affording healthcare was highest among respondents living in lower- and middle-income
households and among those living in households with a person with a disability (see Table 1).
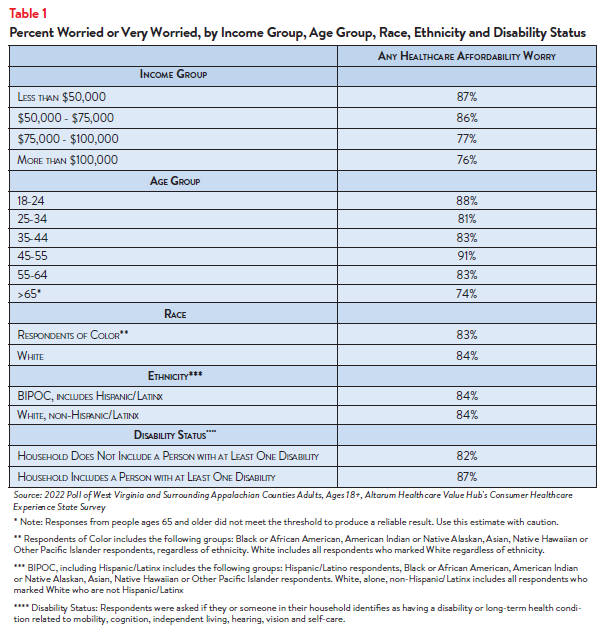
More than 4 in 5 (87%) of respondents with household incomes of less than $75,000 per year2 reported
worrying about affording some aspect of coverage or care in the past year. Still, most Appalachian
Region respondents of all incomes, age, races and levels of ability are somewhat or very concerned.
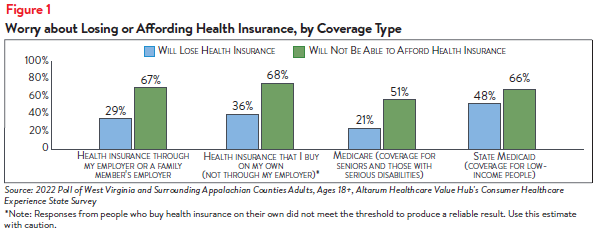
Concern that health insurance will become unaffordable is also more prevalent among certain groups
of respondents in the WVSAC region: By insurance type, respondents with coverage that they have
purchased on their own, not through their employer, most frequently reported worrying about
affording coverage, followed by respondents with coverage through their employer and those with
Medicaid (see Figure 1).
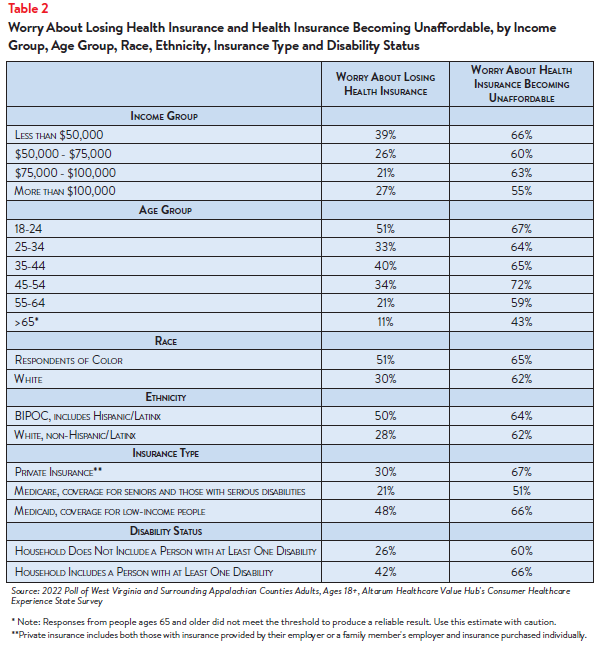
Respondents with household incomes below $50,000 per year reported the highest rates of worry
about losing coverage and worry about affording coverage. Respondents living in households with a
person with a disability were more likely to be concerned about losing health insurance than residents
living in a household without a person with a disability (see Table 2).
Adults that purchase coverage on their own typically purchase coverage on their state’s Marketplace
or directly from an insurer. Individuals are responsible for the entire cost of the premium and all costsharing amounts; government subsidies are available on a sliding scale for plans on the Marketplace
for those with annual household incomes above 100% of the federal poverty level (FPL).
Adults in the states surveyed are eligible for Medicaid with annual household incomes up to 138%
of the federal poverty level—$18,754 for an individual and $38,295 for a family of four in 2022.3
When income levels increase above the threshold, beneficiaries are no longer eligible for coverage. If
income levels fluctuate above and below 138% FPL, beneficiaries will enroll and un-enroll in Medicaid
coverage during a short period in time—a phenomenon called churn—which can cause difficulties in
maintaining coverage and accessing care.
Medicaid provides generous coverage for many healthcare services with little to no cost-sharing
for beneficiaries. Private insurance plans have varying levels of covered services and cost-sharing;
consumers can be responsible for thousands of dollars in cost-sharing amounts, depending on the
plan, needed medical services and if an employer pays for part of the premium for its employees.4
Concerns about affording coverage exceeded fears about losing coverage across all income groups,
age groups, disability statuses, race and ethnicities and coverage types.
Differences in Healthcare Affordability Burdens
The survey also revealed differences in how respondents in the WVSAC region experience healthcare
affordability burdens by income, age, race and ethnicity and disability status.
Income and Age
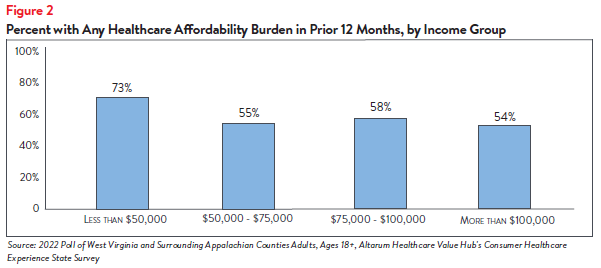
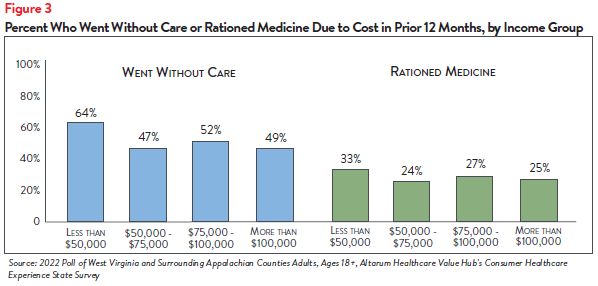
Unsurprisingly, respondents at the lowest end of the income spectrum most frequently reported
experiencing one or more healthcare affordability burdens, with nearly three-fourths (73%) of those
earning less than $50,000 per year reporting struggling to afford some aspect of coverage or care
in the past 12 months (see Figure 2). This may be due, in part, to respondents in this income group
reporting higher rates of going without care and rationing their medication due to cost (see Figure 3).
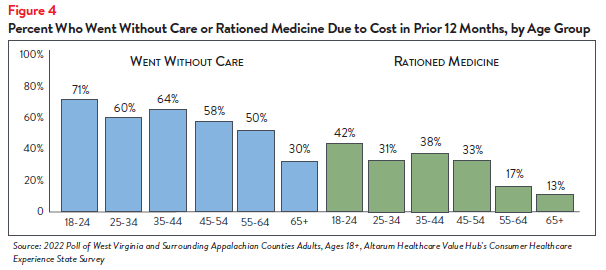
Further analysis found that WVSAC region respondents ages 18-54 were more likely to go without
care due to cost than respondents ages 55 and older (see Figure 4). Respondents ages 18-54 also
most frequently reported rationing medication due to cost, compared to other age groups.
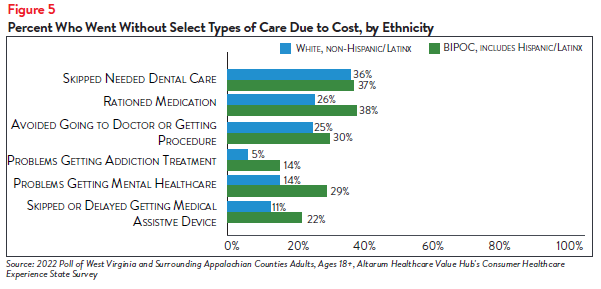
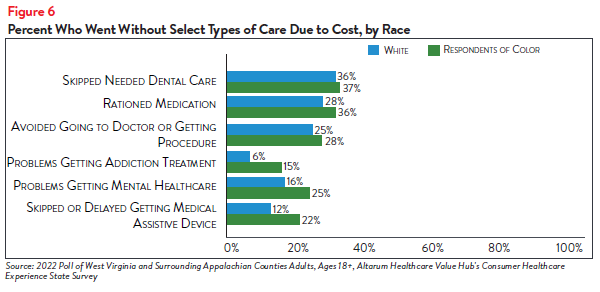
Race and Ethnicity
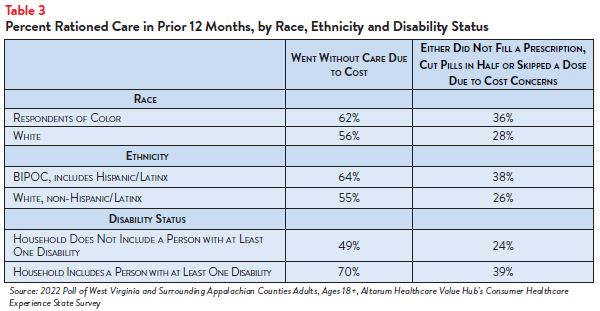
WVSAC region respondents of color reported higher rates of rationing medication and forgoing care
than white respondents. Sixty-two percent of respondents of color went without care due to cost in
the past twelve months (see Table 3).
Further analysis showed that respondents of color also reported higher rates of challenges receiving mental health care and getting addiction treatment (see Figures 5 and 6).
Disability Status
Of all the demographic groups measured, respondents living in households with a person with a
disability reported the highest rates of going without care and rationing medication due to cost in
the past 12 months. Seven in ten (70%) of respondents in this group reported going without some
form of care and 39% reported rationing medication, compared to 49% and 24% of respondents
living in households without a person with a disability, respectively (see Table 3). Respondents living in
households with a person with a disability also more frequently reported delaying or skipping getting
mental healthcare, addiction treatment and dental care, among other healthcare services, than those
in households without a person with a disability, due to cost concerns (see Table 4).
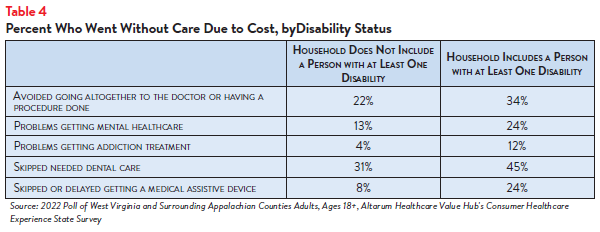
Those with disabilities also face healthcare affordability burdens unique to their disabilities—24% of
respondents reporting a disability in their household reported delaying getting a medical assistive
device such as a wheelchair, cane/walker, hearing aid or prosthetic limb due to cost. Just 8% of
respondents without a person with a disability (who may have needed such tools temporarily or may
not identify as having a disability) reported having this experience.
Encountering Medical Debt
The survey also showed differences in the prevalence of financial burdens due to medical bills,
including going into medical debt, depleting savings and being unable to pay for basic necessities (like
food, heat and housing) by income, race and ethnicity, disability status and insurance type.
Sixty-three percent of respondents of color reported going into debt, depleting savings or going
without other needs due to medical bills, compared to 38% of white respondents (see Table 5).
Additionally, Table 5 details how different populations experience medical debt—from using up savings
to going without basic necessitates to having bills in collections. Medical debt can have further
ramifications, such as acquiring additional types of debt and facing lawsuits.5
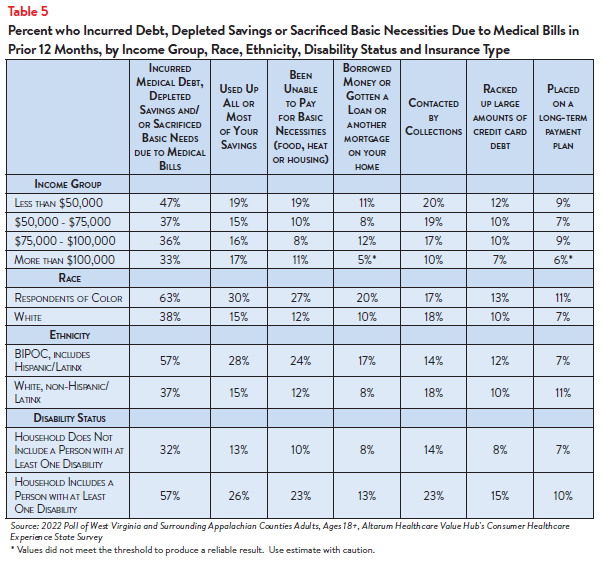
The rate of financial burden is also high for respondents who have or live with a person with a
disability, with nearly three-fifths (57%) reporting going into debt or going without other needs due
to medical bills, compared to 32% of respondents living in households without a disabled member.
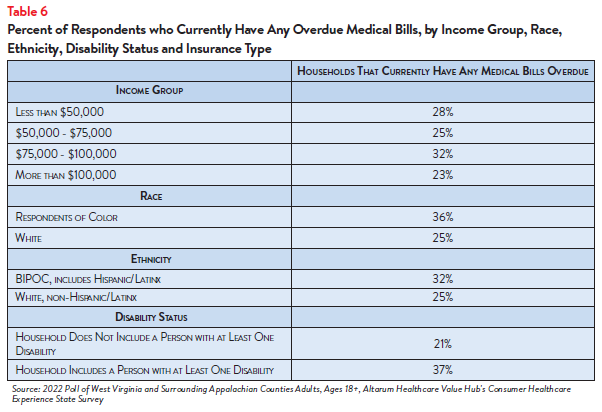
Overall, many respondents across demographic groups reported similar rates of having an overdue
medical bill (see Table 6).
Dissatisfaction with the Health System and Support for Change
In light of respondents in the WVSAC region’s healthcare affordability burdens and concerns, it is not
surprising that they are dissatisfied with the health system:
- Just 28% agreed or strongly agreed that “we have a great healthcare system in the U.S.,”
- While 68% agreed or strongly agreed that “the system needs to change.”
To investigate further, the survey asked about both personal and governmental actions to address
health system problems.
Personal Actions
Respondents in the WVSAC region see a role for themselves in addressing healthcare
affordability. When asked about specific actions they could take:
- 51% of respondents reported researching the cost of a drug beforehand, and
- 79% said they would be willing to switch from a brand name to an equivalent generic drug if given the chance.
When asked to select the top three personal actions they felt would be most effective in
addressing healthcare affordability (out of ten options), the most common responses were:
- 66%—Take better care of my personal health
- 37%—Research treatments myself, before going to the doctor
- 28%—Write to or call my STATE representative asking them to take action on high healthcare prices and lack of affordable coverage options
- 29%—There is not anything I can do personally to make our health system better
Government Actions
But far and away, respondents in the WVSAC region see government as the key stakeholder that
needs to act to address health system problems. Moreover, addressing healthcare problems is one of
the top priorities that respondents want their elected officials to work on.
At the beginning of the survey, respondents were asked what issues the government should address in
the upcoming year. The top vote getters were:
- 56%—Economy/Joblessness
- 49%—Healthcare
- 38%—Taxes
When asked about the top three healthcare priorities the government should work on, the top vote
getters were:
- 52%—Address high healthcare costs, including prescription drugs
- 37%—Improve Medicare, coverage for seniors and those with serious disabilities
- 36%—Preserve consumer protections preventing people from being denied coverage or charged more for having a pre-existing medical condition
- 35%—Get health insurance to those who cannot afford coverage6
Of more than 20 options, respondents in the WVSAC region believe the reason for high healthcare
costs is unfair prices charged by powerful industry stakeholders:
- 73%—Drug companies charging too much money
- 71%—Hospitals charging too much money
- 65%—Insurance companies charging too much money
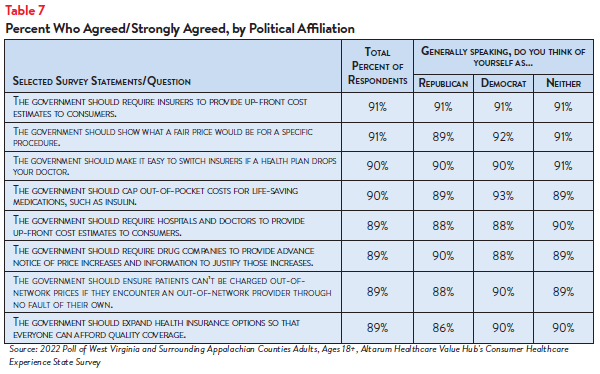
When it comes to tackling costs, respondents endorsed a number of strategies, including:
- 91%—Require insurers to provide up-front cost estimates to consumers
- 91%—Show what a fair price would be for specific procedures
- 90%—Make it easy to switch insurers if a health plan drops your doctor
- 90%—Cap out-of-pocket costs for life-saving medications, such as insulin
- 89%—Require hospitals and doctors to provide up-front cost estimates to consumers
- 89%—Require drug companies to provide advanced notice of prices increases and information to justify those increases
- 89%—Ensure patients can’t be charged out-of-network prices if they encounter an out-ofnetwork provider through no fault of their own
- 89%—Expand health insurance options so that everyone can afford quality coverage
Support for Action Across Party Lines
There is also remarkable support for change regardless of respondents’ political affiliation (see Table
7).
The high burden of healthcare affordability, along with high levels of support for change, suggest that
elected leaders and other stakeholders need to make addressing this consumer burden a top priority.
Moreover, the COVID crisis has led state residents to take a hard look at how well health and public
health systems are working for them, with strong support for a wide variety of actions. Annual surveys
can help assess whether progress is being made.
Notes
- Of the current 57% of respondents in the WVSAC region who encountered one or more cost-related barriers to getting healthcare during the prior 12 months, 24% did not fill a prescription, while 18% cut pills in half or skipped doses of medicine due to cost.
- The majority of the WVSAC region counties targeted in the CHESS are in West Virginia. Median household income in West Virginia was $48,037 (2016-2020). U.S. Census, Quick Facts. Retrieved from: U.S. Census Bureau QuickFacts: West Virginia
- Healthcare.gov, Federal Poverty Level (FPL) https://www.healthcare.gov/glossary/federal-poverty-level-fpl/ (accessed Dec. 22, 2022).
- Kaiser Family Foundation, Cost-Sharing for Plans Offered in the Federal Marketplace, 2014-2022, San Francisco, C.A. (March 21, 2022).
- Consumer Financial Protection Bureau, Medical Debt Burden in the United States, Washington, D.C. (February 2022).
- Over 3 in 5 (65%) of respondents said that they would consider using their tax forms to sign up for free or low-cost health insurance if they or their family needed it. This high level of interest persisted across racial and income groups, with the highest levels of interest among Respondents of Color (77%) and those earning between $75,000-$100,000 annually (72%).
Methodology
Altarum’s Consumer Healthcare Experience State Survey (CHESS) is designed to elicit respondents’ unbiased views on a wide range of health system issues, including confidence using the health system, financial burden and views on fixes that might be needed.
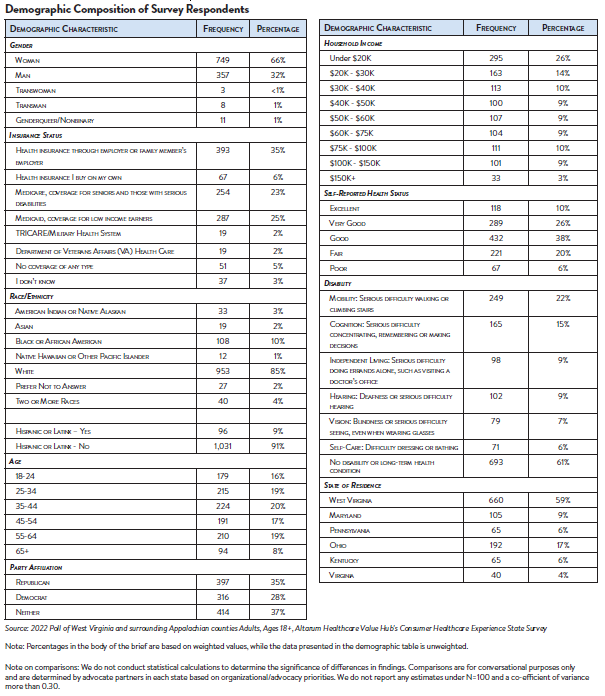
The survey used a web panel from Dynata with a demographically balanced sample of approximately 1,227 respondents who live in West Virginia and surrounding Appalachian counties. The survey was conducted in English or Spanish and restricted to adults ages 18 and older. Respondents who finished the survey in less than half the median time were excluded from the final sample, leaving 1,127 cases for analysis. After those exclusions, the demographic composition of respondents was as follows, although not all demographic information has complete response rates:
Appendix A: List of West Virginia and Surrounding Appalachian Counties Surveyed
This survey focused on West Virginia and included counties in surrounding states that directly border West Virginia and are defined as an Appalachian county by the Appalachian Regional Commission. Surrounding Appalachian counties were included in the survey in order to obtain an adequate sample needed to achieve a reliable result. The surrounding counties were chosen by advocate partners as being similar in nature to West Virginia, including Medicaid expansion.
| State | County | State | County | ||||
| West Virginia | Barbour | West Virginia | Summers | ||||
| West Virginia | Berkeley | West Virginia | Taylor | ||||
| West Virginia | Boone | West Virginia | Tucker | ||||
| West Virginia | Braxton | West Virginia | Tyler | ||||
| West Virginia | Brooke | West Virginia | Upshur | ||||
| West Virginia | Cabell | West Virginia | Wayne | ||||
| West Virginia | Calhoun | West Virginia | Webster | ||||
| West Virginia | Clay | West Virginia | Wetzel | ||||
| West Virginia | Doddridge | West Virginia | Wirt | ||||
| West Virginia | Fayette | West Virginia | Wood | ||||
| West Virginia | Gilmer | West Virginia | Wyoming | ||||
| West Virginia | Grant | Maryland | Garrett | ||||
| West Virginia | Greenbrier | Maryland | Allegany | ||||
| West Virginia | Hampshire | Maryland | Washington | ||||
| West Virginia | Hancock | Pennsylvania | Beaver | ||||
| West Virginia | Hardy | Pennsylvania | Washington | ||||
| West Virginia | Harrison | Pennsylvania | Greene | ||||
| West Virginia | Jackson | Pennsylvania | Fayette | ||||
| West Virginia | Jefferson | Ohio | Columbiana | ||||
| West Virginia | Kanawha | Ohio | Jefferson | ||||
| West Virginia | Lewis | Ohio | Belmont | ||||
| West Virginia | Lincoln | Ohio | Monroe | ||||
| West Virginia | Logan | Ohio | Washington | ||||
| West Virginia | McDowell | Ohio | Athens | ||||
| West Virginia | Marion | Ohio | Meigs | ||||
| West Virginia | Marshall | Ohio | Gallia | ||||
| West Virginia | Mason | Ohio | Lawrence | ||||
| West Virginia | Mercer | Kentucky | Boyd | ||||
| West Virginia | Mineral | Kentucky | Lawrence | ||||
| West Virginia | Mingo | Kentucky | Martin | ||||
| West Virginia | Monongalia | Kentucky | Pike | ||||
| West Virginia | Monroe | Virginia | Buchanan | ||||
| West Virginia | Morgan | Virginia | Tazewell | ||||
| West Virginia | Nicholas | Virginia | Bland | ||||
| West Virginia | Ohio | Virginia | Giles | ||||
| West Virginia | Pendleton | Virginia | Craig | ||||
| West Virginia | Pleasants | Virginia | Alleghany | ||||
| West Virginia | Pocahontas | Virginia | Bath | ||||
| West Virginia | Preston | Virginia | Highland | ||||
| West Virginia | Putnam | ||||||
| West Virginia | Raleigh | ||||||
| West Virginia | Randolph | ||||||
| West Virginia | Ritchie | ||||||
| West Virginia | Roane |

HEALTHCARE VALUE HUB
The Healthcare Value Hub can help you find free, timely information about policies and practices to achieve health systems that are equitable, affordable, and focused on the goals and needs of the people the system is meant to serve.
Share
![]()
![]()
![]()

Follow
![]()
![]()


![]()