Oregon Residents Struggle to Afford High Healthcare Costs; COVID Fears Add to Support for a Range of Government Solutions Across Party Lines
Nationally, consumer worry about healthcare affordability is well documented but now—for the first time—a new survey reveals how affordability concerns and ideas for action play out in Oregon.
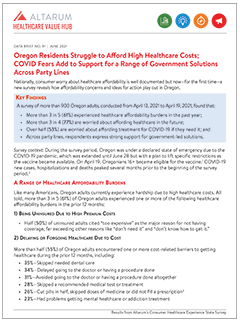
Key FindingsA survey of more than 900 Oregon adults, conducted from April 13, 2021 to April 19, 2021, found that:
|
Survey context: During the survey period, Oregon was under a declared state of emergency due to the COVID-19 pandemic, which was extended until June 28 but with a plan to lift specific restrictions as the vaccine became available. On April 19, Oregonians 16+ became eligible for the vaccine.1 COVID-19 new cases, hospitalizations and deaths peaked several months prior to the beginning of the survey period.2
A Range of Healthcare Affordability Burdens
Like many Americans, Oregon adults currently experience hardship due to high healthcare costs. All told, more than 3 in 5 (61%) of Oregon adults experienced one or more of the following healthcare affordability burdens in the prior 12 months:
1) Being Uninsured Due to High Premium Costs
- Half (50%) of uninsured adults cited “too expensive” as the major reason for not having coverage, far exceeding other reasons like “don’t need it” and “don’t know how to get it.”
2) Delaying or Forgoing Healthcare Due to Cost
More than half (55%) of Oregon adults encountered one or more cost-related barriers to getting healthcare during the prior 12 months, including:
- 35%—Skipped needed dental care
- 34%—Delayed going to the doctor or having a procedure done
- 31%—Avoided going to the doctor or having a procedure done altogether
- 28%—Skipped a recommended medical test or treatment
- 26%—Cut pills in half, skipped doses of medicine or did not fill a prescription3
- 23%—Had problems getting mental healthcare or addiction treatment
Moreover, cost was by far the most frequently cited reason for not getting needed medical care, exceeding a host of other barriers like transportation, difficulty getting an appointment and lack of childcare.
Of the various types of medical bills, the ones most frequently associated with an affordability barrier were dental bills, doctor bills and prescription drugs, likely reflecting the frequency with which Oregon adults seek these services—or, in the case of dental, perhaps lower rates of coverage for these services.
3) Struggling to Pay Medical Bills
Other times, Oregon adults got the care they needed but struggled to pay the resulting bill. More than 1 in 3 (34%) of Oregon adults experienced one or more of these struggles to pay their medical bills:
- 13%—Contacted by a collection agency
- 13%—Used up all or most of their savings
- 10%—Unable to pay for basic necessities like food, heat or housing
- 10%—Borrowed money, got a loan or another mortgage on their home
- 9%—Racked up large amounts of credit card debt
- 8%—Placed on a long-term payment plan
High Levels of Worry About Affording Healthcare in the Future
Oregon adults also exhibit high levels of worry about affording healthcare in the future. Overall, 3 in 4 (77%) report being “worried” or “very worried” about affording some aspect of healthcare in the future, including:
- 63%—Cost of affording nursing home or home care services
- 61%—Health insurance will become too expensive
- 60%—Medical costs when elderly
- 60%—Medical costs in the event of a serious illness or accident
While two of the most common worries—affording the cost of nursing home or home care services and medical costs when elderly—are applicable solely to an older population, they were most frequently reported by respondents ages 35-44, followed by respondents ages 45-54. This finding indicates that residents may be worried about affording the cost of care for aging parents, in addition to themselves.
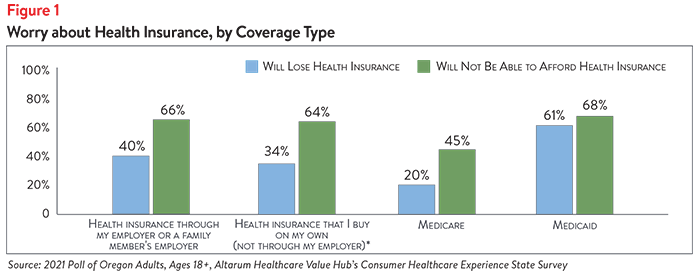
Furthermore, 38% of respondents of all ages are “worried” or “very worried” about losing their health insurance. These concerns vary by type of insurance coverage, with people covered through Medicaid and those with employer-sponsored insurance being most concerned about losing their coverage. Concerns about affording health insurance exceeded fears about losing coverage across all insurance types (see Figure 1).
Income Differences in Healthcare Affordability Burdens
The survey also revealed income differences in how Oregon adults experience healthcare affordability burdens.
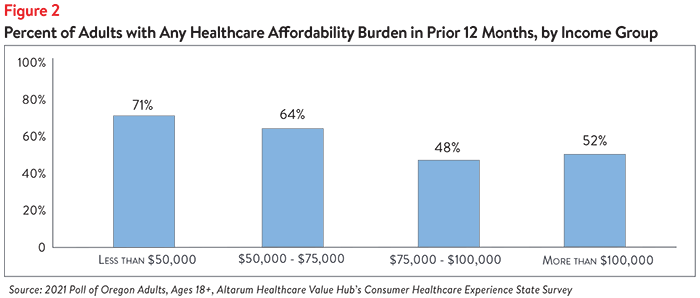
Affordability burdens affect families quite far up the income ladder, with over half (52%) of residents with household incomes of $100,000 or more struggling to afford healthcare in the past 12 months (see Figure 2). Oregon residents earning less than $50,0004 face the greatest burden, with 71% reporting affordability problems.
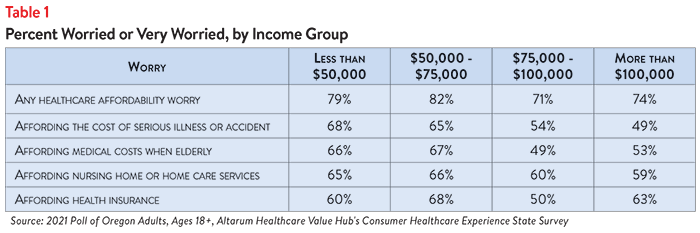
Residents in the lower income brackets also report higher levels of worry about affording healthcare costs in the future; however, even households making more than $100,000 per year are worried about affording coverage and care (see Table 1).
COVID Worries
In addition to affordability worries, Oregon adults were asked about their top worries related to the COVID crisis.5 When asked about “affording treatment of coronavirus/COVID-19 if you need it,” 53% of respondents were somewhat worried or very worried.
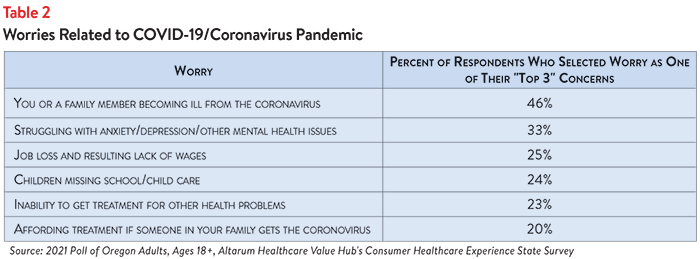
Separately, out of twelve possible responses, respondents were asked to pick the top three things they were most worried about (see Table 2). “Becoming ill from the virus” was not only most frequently selected by respondents, but it exceeded other worries by a wide margin. Forty-six percent of respondents selected “Becoming ill from the virus” as one of their top three concerns, while 33% of respondents selected the next most common worry, “Struggling with anxiety/depression/other mental health issues,” as a top three concern.
In smaller numbers, Oregon adults worry about many other issues, including: safety at work—not getting the virus at work (20%), decreased value of retirement savings (18%), job loss and resulting loss of health coverage (17%), and unavailability of COVID treatment if they or a family member gets sick (9%).
Though the increased availability of COVID-19 vaccines may have somewhat lessened respondents’ worries surrounding the virus, it is important to note that over half of respondents remain somewhat or very worried.
Dissatisfaction with the Health System and Support for Change
In light of these healthcare affordability and COVID concerns, it is not surprising that Oregon adults were extremely dissatisfied with the health system. Statewide:
- Just 26% agreed or strongly agreed that “we have a great healthcare system in the U.S.,”
- While 71% agreed or strongly agreed that “the system needs to change.”
The survey asked about both personal and governmental actions to address health system problems.
Personal Actions
Oregon adults do see a role for themselves in addressing healthcare affordability. Respondents reported specific actions they had already taken, like researching the cost of a drug beforehand (56%), as well as action they should be taking—76% said they would switch from a brand to an equivalent generic drug if given a chance.
When asked to select the top three personal actions that would be most effective in addressing healthcare affordability (out of ten options), the most common responses were:
- 61%—Take better care of my personal health
- 38%—Write or call my FEDERAL representative asking them to take action
- 36%—Write or call my STATE representative asking them to take action
- 35%—Research treatments myself, before going to the doctor
Government Actions
But far and away, Oregon residents see government as the key stakeholder that needs to act to address health system problems. Moreover, addressing healthcare problems is a top priority that Oregon residents want their elected representatives to work on.
At the beginning of the survey, respondents were asked what issues the government should address in the upcoming year. The top vote getters were:
- 56%—Healthcare
- 53%—Economy/Joblessness
- 35%—Environment/Energy
The economic woes brought on by the COVID crisis likely contributed to “Economy/Joblessness” as a primary concern, but addressing healthcare remains the top issue for Oregon adults.
When asked about the top three healthcare priorities the government should work on, top vote getters were:
- 50%—Address high healthcare costs, including prescription drugs
- 35%—Preserve consumer protections preventing people from being denied coverage or charged more for having a pre-existing medical condition
- 34%—Get health insurance to those who cannot afford coverage
Of more than 20 options, Oregon adults believe the reason for high healthcare costs is unfair prices charged by powerful industry stakeholders:
- 74%—Drug companies charging too much money
- 68%—Insurance companies charging too much money
- 66%—Hospitals charging too much money
When it comes to tackling costs, respondents endorsed a number of strategies, including:
- 92%—Make it easy to switch insurers if a health plan drops your doctor
- 92%—Show what a fair price would be for specific procedures
- 91%—Require insurers to provide up-front cost estimates to consumers
- 91%—Require hospitals and doctors to provide up-front cost estimates to consumers
- 90%—Ensure the cost of widely needed vaccines are affordable for all
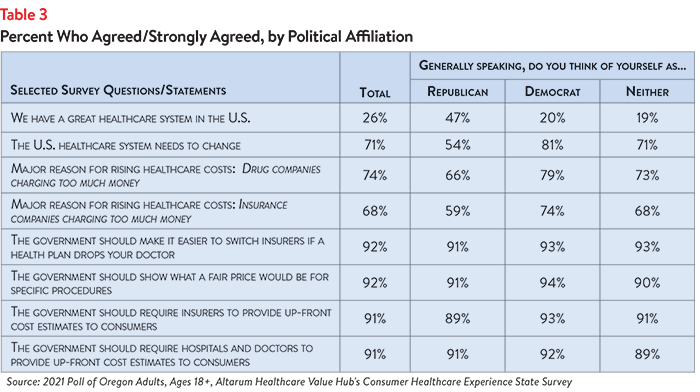
Support for Action Across Party Lines
What is remarkable about is high support for change regardless of respondents’ political affiliation (see Table 3).
Policies to Address COVID Concerns
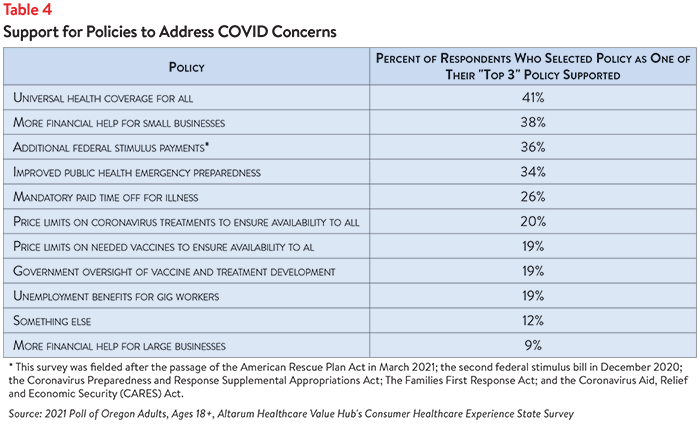
In addition to residents’ views on the policies and approaches above, new questions were asked about support for and against policies related to the COVID crisis. Out of eleven possible responses, respondents were asked to pick the top three policies that would help address COVID-related problems. There was significant diversity in the policies supported, with the highest percentages of respondents selecting “Universal health coverage for all” and “More financial help for small businesses” as a top three priority (see Table 4). “More financial help for large businesses” received the least support, as it was a priority for only a small percentage of respondents.
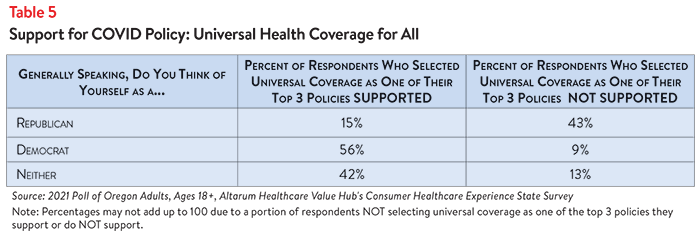
When respondents were asked about which policies they did NOT support, 36% indicated that they did not support “More financial help for large businesses.” Trailing substantially behind that (with 18% of respondents selecting) was “Universal health coverage for all,” although a higher percentage of respondents indicated support. In this area, there was a lack of agreement across party lines, with Republicans far more likely to NOT support “Universal health coverage for all” as a means to address COVID-19 concerns, compared to Democrats and those not affiliated with either party (see Table 5). It is important to note, however, that when asked generically about “Expanding health insurance options so that everyone can afford quality coverage,” 89% of respondents agreed or strongly agreed with this policy as a means of improving affordability, with high levels of support across party lines.
When asked about the policies they did NOT support, respondents were given the option of selecting “I support all of the policies listed.” Thirty-three percent of respondents selected this option.
The high burden of healthcare affordability, along with high levels of support for change, suggest that elected leaders and other stakeholders need to make addressing this consumer burden a top priority. Moreover, the current COVID crisis is leading state residents to take a hard look at how well health and public health systems are working for them, with strong support for a wide variety of actions. Annual surveys can help assess whether or not progress is being made.
Notes
1. Everyone 16 and Older in Oregon Now Eligible for COVID-19 Vaccine, KWG8 (April 19, 2021). https://www.kgw.com/article/news/health/coronavirus/vaccine/16-and-older-oregon-eligible-covid-19-vaccine/283-037b0a85-1760-4451-a388-96400a583f05
2. COVID-19 Data Dashboards, Oregon Health Authority, (Accessed June 2, 2021). https://public.tableau.com/app/profile/oregon.health.authority.covid.19/viz/OregonsCOVID-19DataDashboards-TableofContents/TableofContentsStatewide
3. Of the current 55% of Oregon adults who encountered one or more cost-related barriers to getting healthcare during the prior 12 months, 19% did not fill a prescription, while 18% cut pills in half or skipped doses of medicine due to cost.
4. Median household income in Oregon was $62,818 (2015-2019). U.S. Census, Quick Facts. Retrieved from: U.S. Census Bureau QuickFacts: Oregon
5. COVID-19 is the disease caused by the coronavirus, which was characterized as a pandemic by the World Health Organization on March 11, 2020. For a comparison of how respondents from Connecticut, Kentucky, Mississippi and New Jersey answered our COVID questions, please see Healthcare Value Hub, How COVID Has Shaped Residents’ Broader Attitudes Towards the Health System, Data Brief No. 86.
Methodology
Altarum’s Consumer Healthcare Experience State Survey (CHESS) is designed to elicit respondents’ unbiased views on a wide range of health system issues, including confidence using the health system, financial burden and views on fixes that might be needed.
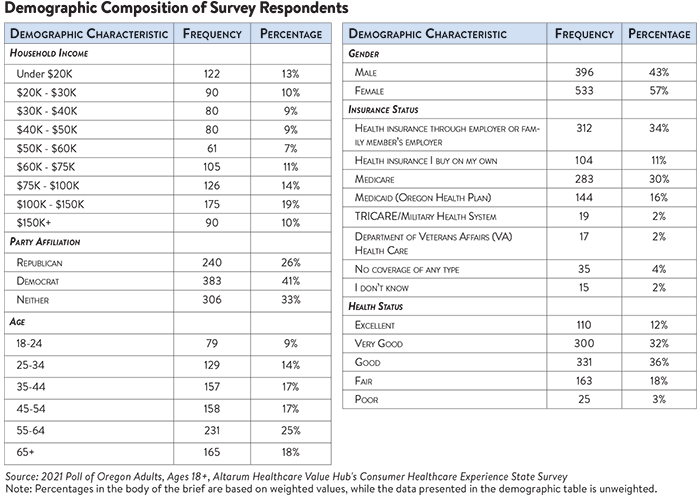
The survey used a web panel from Dynata with a demographically balanced sample of approximately 1,000 respondents who live in Oregon. The survey was conducted in English or Spanish and restricted to adults ages 18 and older. Respondents who finished the survey in less than half the median time were excluded from the final sample, leaving 929 cases for analysis. After those exclusions, the demographic composition of respondents was as follows, although not all demographic information has complete response rates:

Oregon Survey Results
2024
Statewide Reports
Prescription Drug Affordability
2021
Statewide Reports
Prescription Drug Affordability
Report Download
|
HEALTHCARE VALUE HUB
The Healthcare Value Hub can help you find free, timely information about policies and practices to achieve health systems that are equitable, affordable, and focused on the goals and needs of the people the system is meant to serve.
Share
![]()
![]()
![]()

Follow
![]()
![]()


![]()