Oregon Survey Respondents Bear Health Care Affordability Burdens Unequally; Distrust of/Disrespect by Health Care Providers Leads Some to Delay/Go Without Needed Care
Key Findings
A survey of more than 1,400 Oregon adults, conducted from June 6 to June 17, 2024, found that:
- Over 3 in 4 (76%) experienced at least one health care affordability burden in the past year;
- Over 4 in 5 (83%) worry about affording health care in the future;
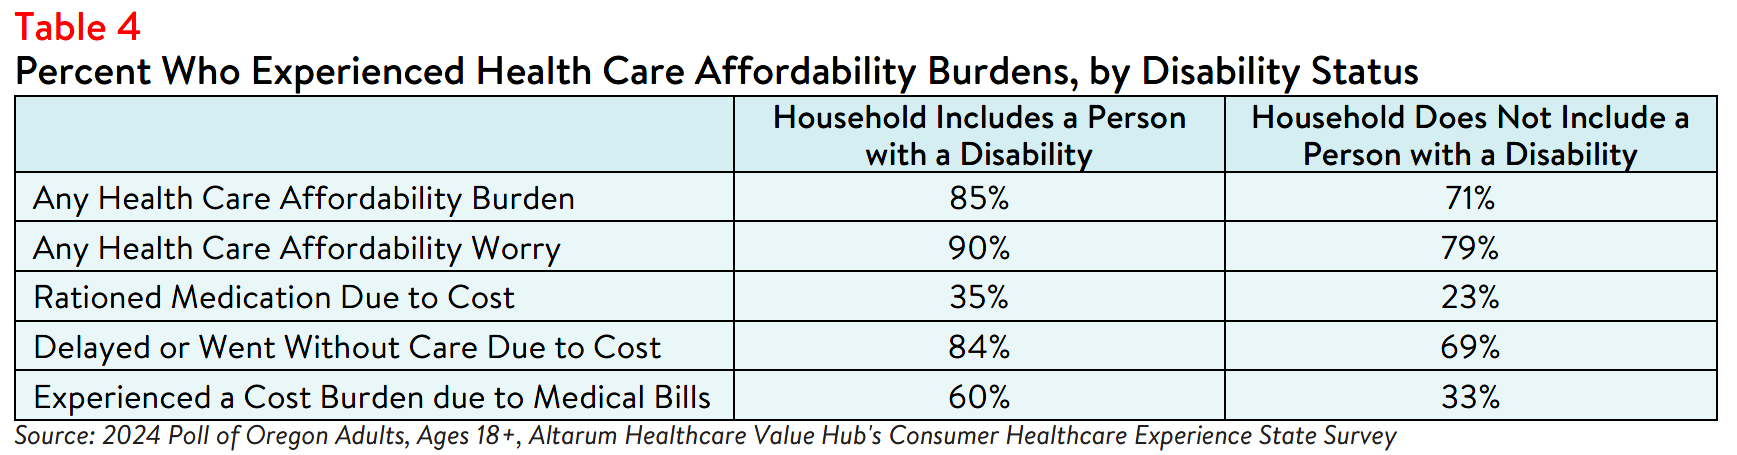
- Respondents living in households with a person with a disability more frequently reported rationing medication due to cost (35% versus 23%); delaying or going without care due to cost (84% versus 69%); and experiencing a cost burden due to medical bills (60% versus 33%).
- Respondents of color more frequently reported experiencing one or more health care affordability burdens in the past year compared to white respondents;
- Fifty percent of respondents of color skipped needed medical care due to distrust of or feeling disrespected by health care providers, compared to 28% of white alone, non-Hispanic respondents; and
- Sixty-four percent of all respondents think that people are treated unfairly based on their race or ethnic background somewhat or very often in the U.S. health care system.
Difference in Affordability Burdens & Concerns
Race and Ethnicity
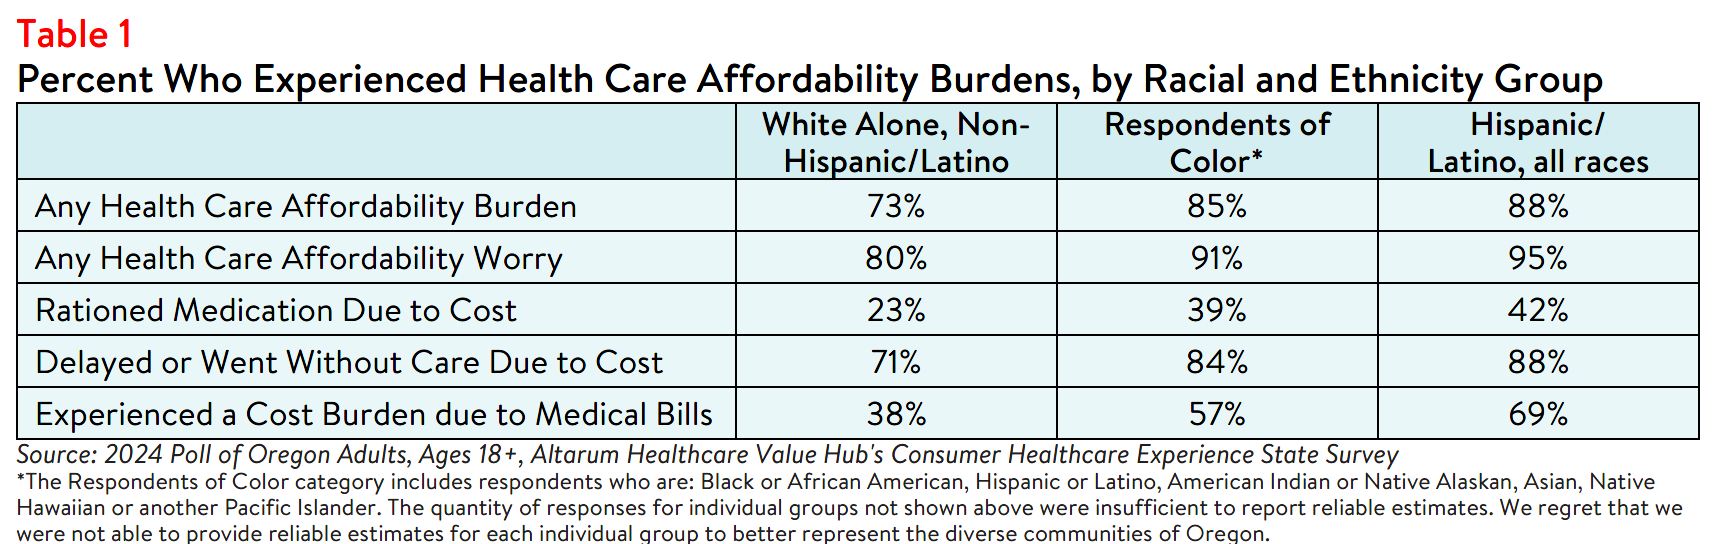
Health disparities and a lack of affordable care negatively impact many communities of color, particularly
Black, Hispanic and Latino communities.1,2 Oregon respondents of color reported higher rates of many
affordability burdens when compared to white alone, non-Hispanic/Latino respondents, including cost
burdens due to medical bills (see Table 1).3
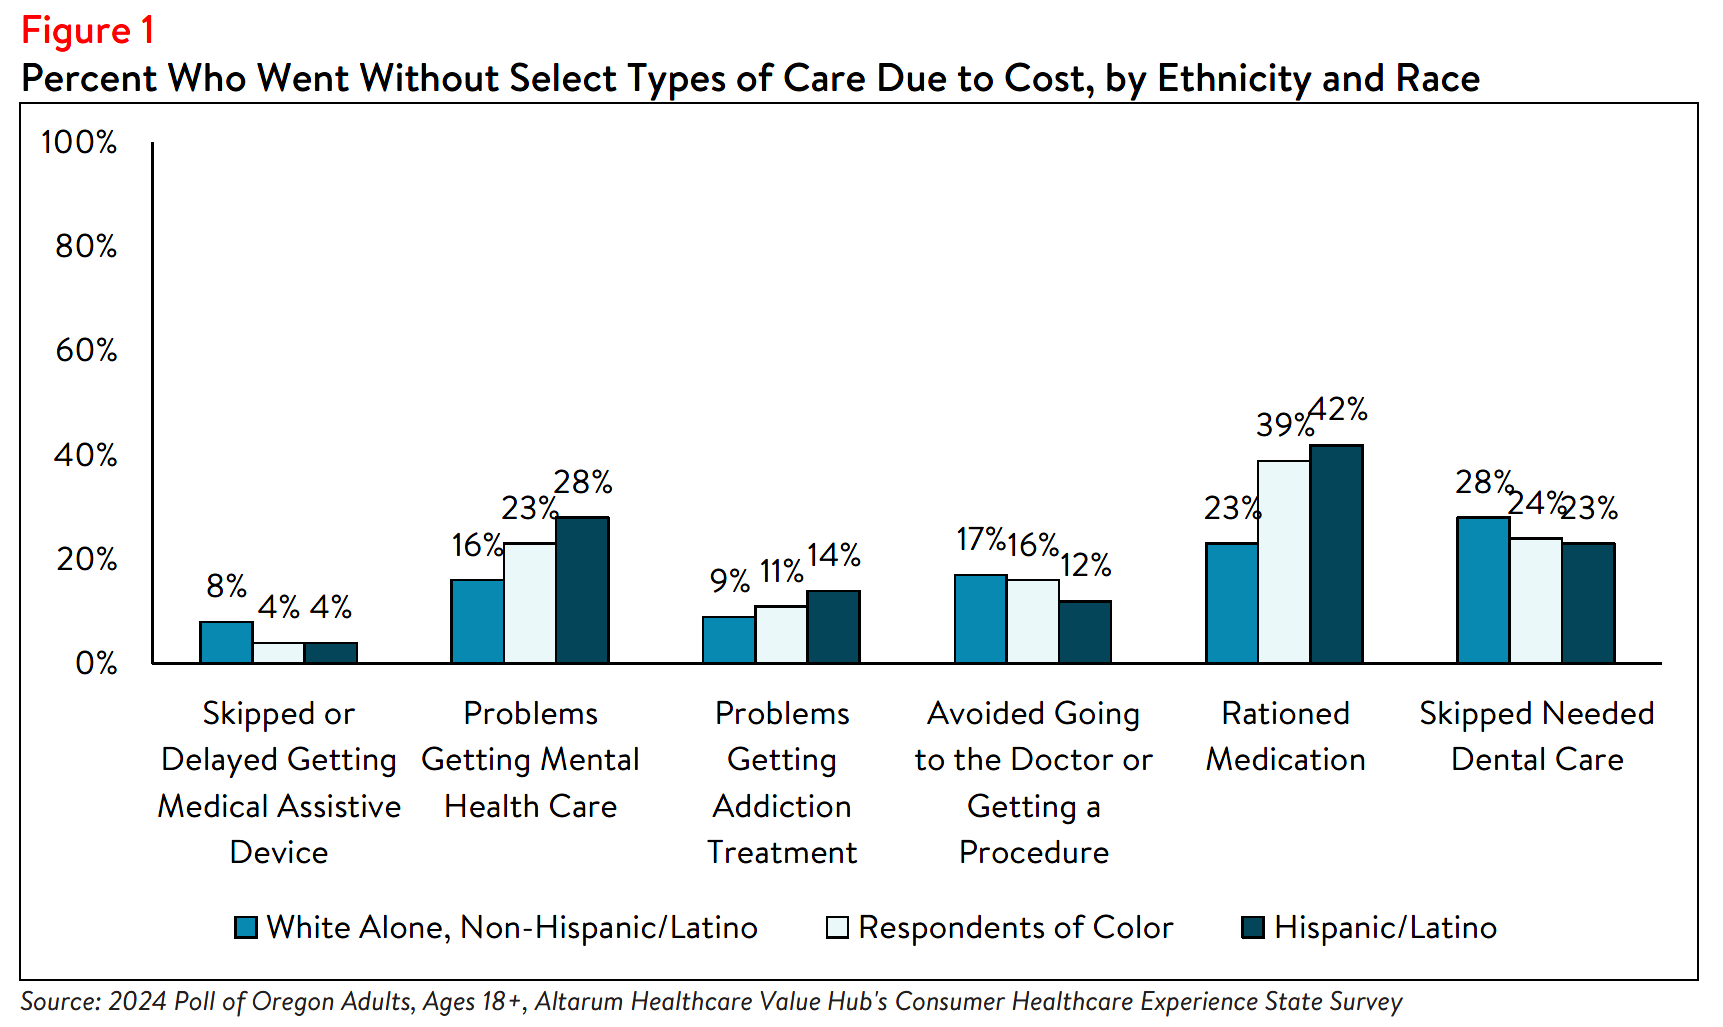
Respondents of color also more frequently reported difficulty attaining select types of care compared to
white, non-Hispanic respondents. For example, Hispanic/Latino respondents more frequently reported
challenges accessing mental health care and addiction treatment, as well as avoiding going to the doctor
or getting a procedure done to cost (see Figure 1).
A small share of respondents also reported barriers to care that were unique to their ethnic or cultural
backgrounds. Three percent of respondents reported not getting needed medical care because they
couldn’t find a doctor of the same race, ethnicity or cultural background as them and two percent of
respondents reported not getting needed care because they couldn’t find a doctor who spoke their
language.
Income and Education
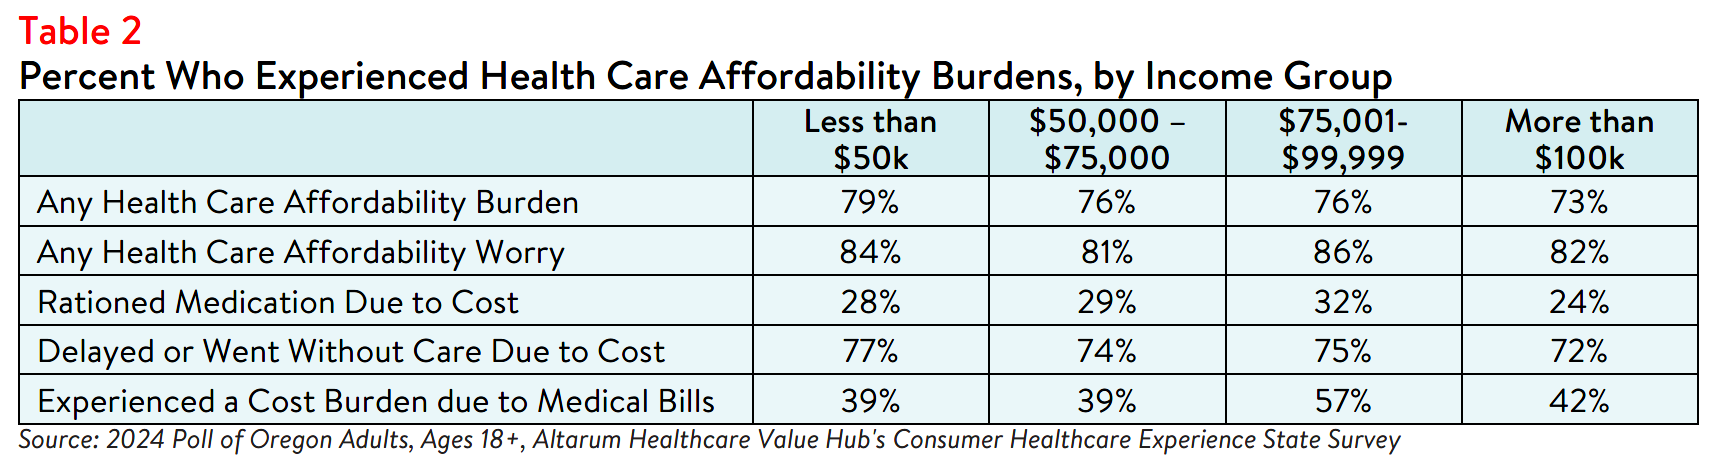
The survey also highlighted differences in health care affordability burdens between different income and
educational levels. Respondents living in households earning below $50,000 per year most frequently
reported experiencing an affordability burden, with 79% reporting a financial burden in the past twelve
months (see Table 2). Additionally, 28% of respondents with an annual household income of $50,000 or
less reported not filling a prescription, skipping doses, or cutting pills in half due to cost.
Those earning $75,001 to less than $100,000 most frequently reported experiencing a cost burden due to
medical bills, such as incurring medical debt, depleting savings or sacrificing basic needs like food, heat, or housing compared to those earning $100,000 or more annually (57% versus 42%). Still, nearly 3 in 4
respondents living in higher income households also faced affordability issues, indicating that these
burdens affect all income groups. At least 81% of respondents across all income levels expressed concern about affording health care now or in the future.
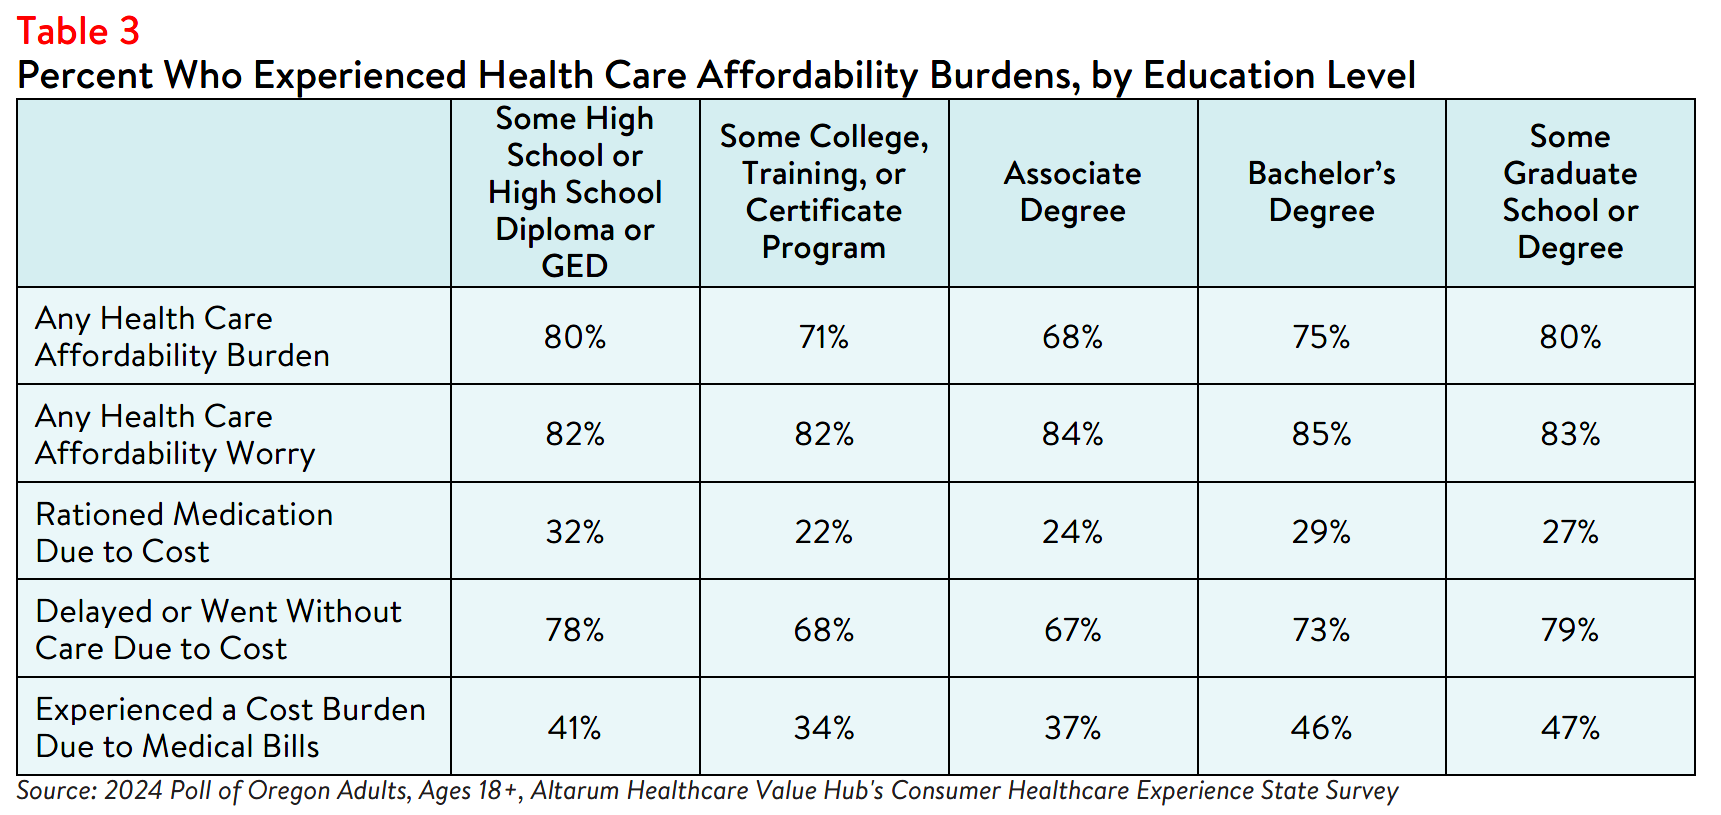
Similarly, Oregon respondents with a Bachelor’s or graduate degree reported experiencing a health care
affordability burden less frequently than respondents with a high school diploma or GED. In contrast,
respondents with some high school or a high school diploma or GED reported experiencing a health care
affordability burden (80%), rationing medication due to cost (32%) and delaying or forgoing care due to
cost (78%) as frequently as other respondents reporting having some graduate school or a graduate
school degree (see Table 3).
The relationship between education and income is well established, however higher education is also
associated with better health outcomes, lower morbidity and greater health care affordability.4
This disparity is influenced by various mediators such as economic status and the likelihood of being employed in a position which offers employee benefits including paid time off, sick leave and health insurance, which are associated with greater utilization of preventive health care.5
Disability Status
People with disabilities interact with the health care system more often than those without disabilities,
which frequently results in greater out-of-pocket costs.6 Additionally, individuals who receive disability benefits face unique coverage challenges that impact their ability to afford care, such as losing coverage if their income or assets exceed certain limits (e.g., after marriage).7
In Oregon, respondents with disabilities or who live with someone with a disability reported more
affordability burdens compared to others (see Table 4). These respondents also worried more about health care affordability in general compared to respondents without a disability or who do not live with a person with a disability (90% versus 79%) and losing health insurance compared to respondents without a disability or who do not live with a person with a disability (48% versus 31%).
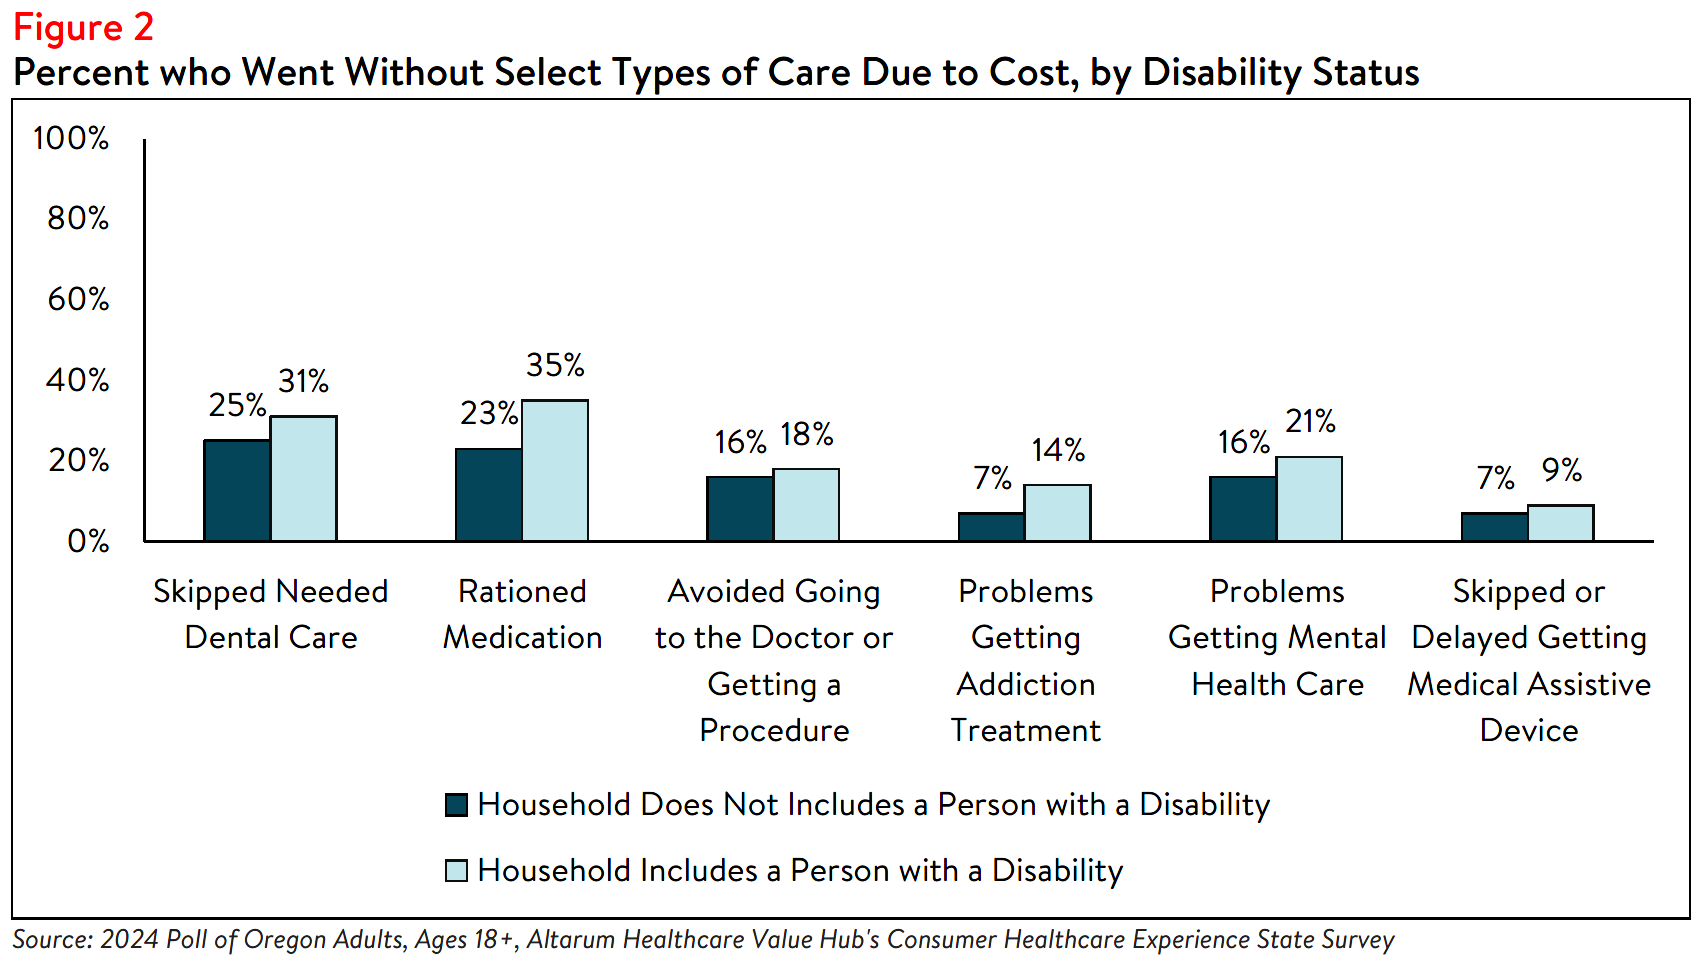
Individuals with disabilities also face unique health care affordability burdens compared to nondisabled
individuals. Nine percent (9%) of respondents with a disability in their household delayed getting a medical assistive device such as a wheelchair, cane, walker, hearing aid or prosthetic limb due to cost, compared to 7% of respondents without a disability who may have required one of these tools for temporary support (see Figure 2). Additionally, 21% of respondents with a disability in their household reported problems accessing mental health care, compared to 16% of those without a disability.
Gender and Sexual Orientation
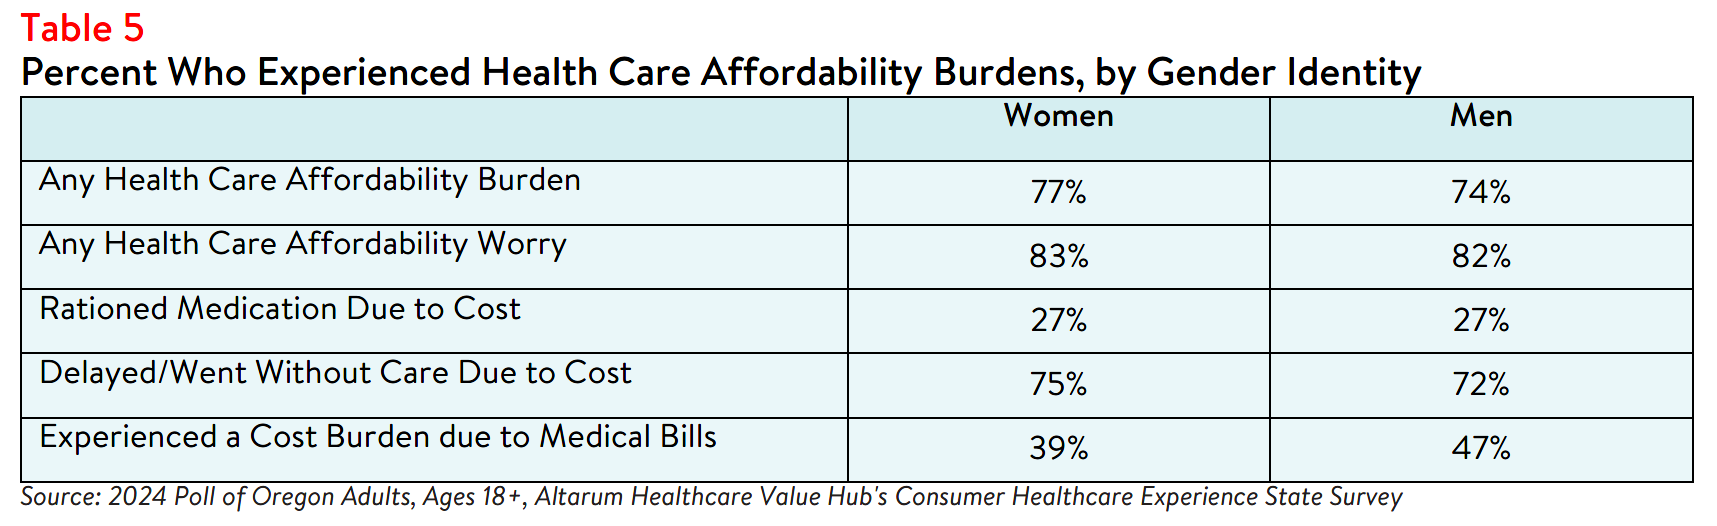
The survey revealed notable differences in health care affordability burdens and concerns based on
gender and sexual orientation. Women reported higher rates of experiencing at least one affordability
burden in the past year compared to men (77% versus 74%) (see Table 5). They also more frequently
reported delaying or forgoing care due to cost. Although many respondents regardless of gender
expressed concern about health care costs, a slightly higher percentage of women worried about affording some aspect of coverage or care compared to men (83% versus 82%). Men reported higher rates of experiencing cost burdens due to medical bills compared to women (47% versus 39%).
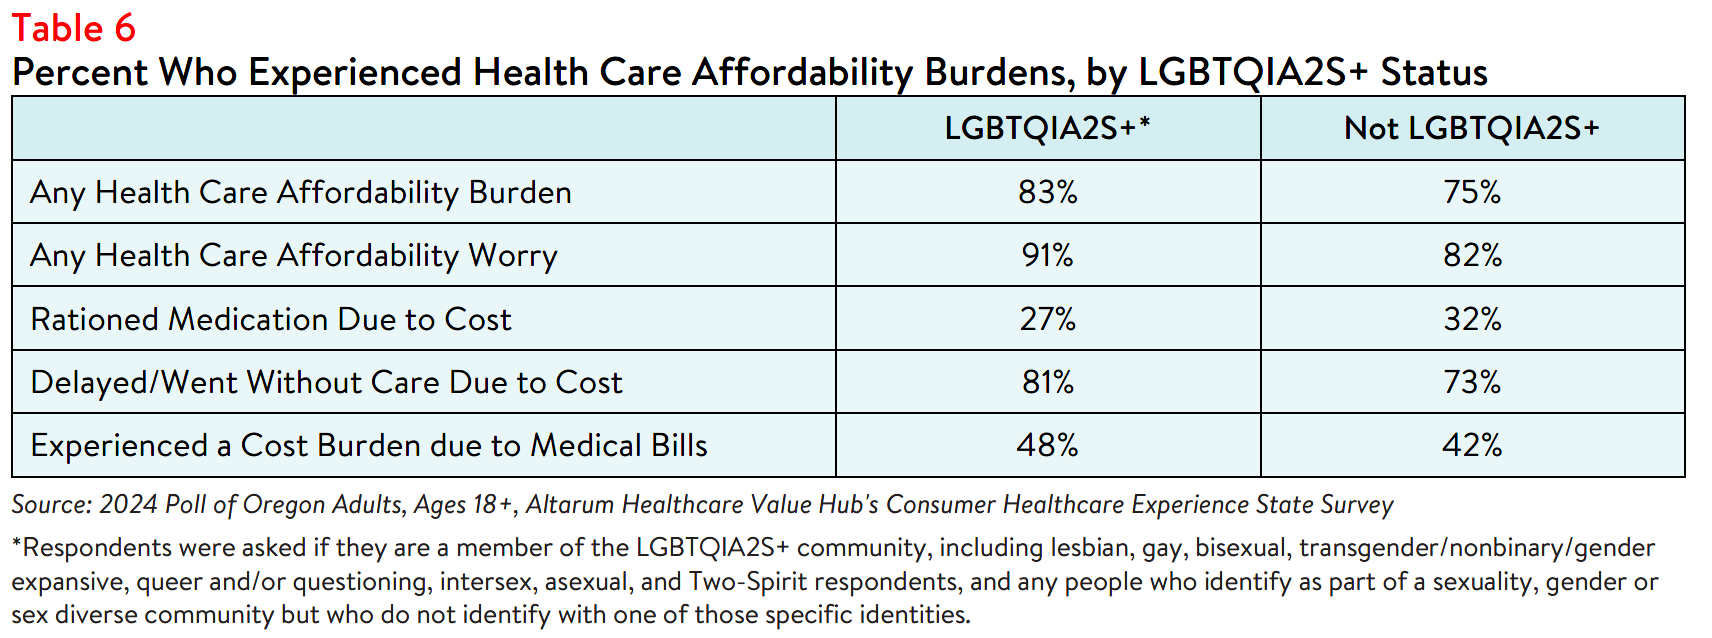
The survey also revealed that LGBTQIA+ respondents more frequently experienced affordability burdens,
with 32% reporting rationing medication due to cost compared to 27% of other respondents (see Table 6).
Members of the LGBTQIA2S+ community may encounter unique challenges accessing health care and
medications, including limited insurance coverage and discrimination within the health care system.8,9
State and federal policies, particularly regarding gender-affirming treatments, can further hinder access
or limit coverage, exacerbating financial strain and health disparities.10 Unfortunately, due to the small
sample size, this survey could not produce reliable estimates exclusively for transgender, genderqueer or
nonbinary respondents..
Distrust and Mistrust in the Health System
Whether a patient trusts or feels respected by their health care provider may influence their willingness to
seek necessary care. In Oregon, more than a quarter (29%) of respondents reported feeling that their
health care providers never, rarely or only sometimes treat them with respect. When asked why they felt
that health care providers did not treat them with respect, respondents most frequently cited income or
financial status (47%), disability (26%), race (16%), gender or gender identity (20%), ethnic background
(22%) and educational attainment (9%). In lesser numbers, some respondents also cited sexual orientation (8%), experience with violence or abuse (9%) and religion (3%) as the primary reason.
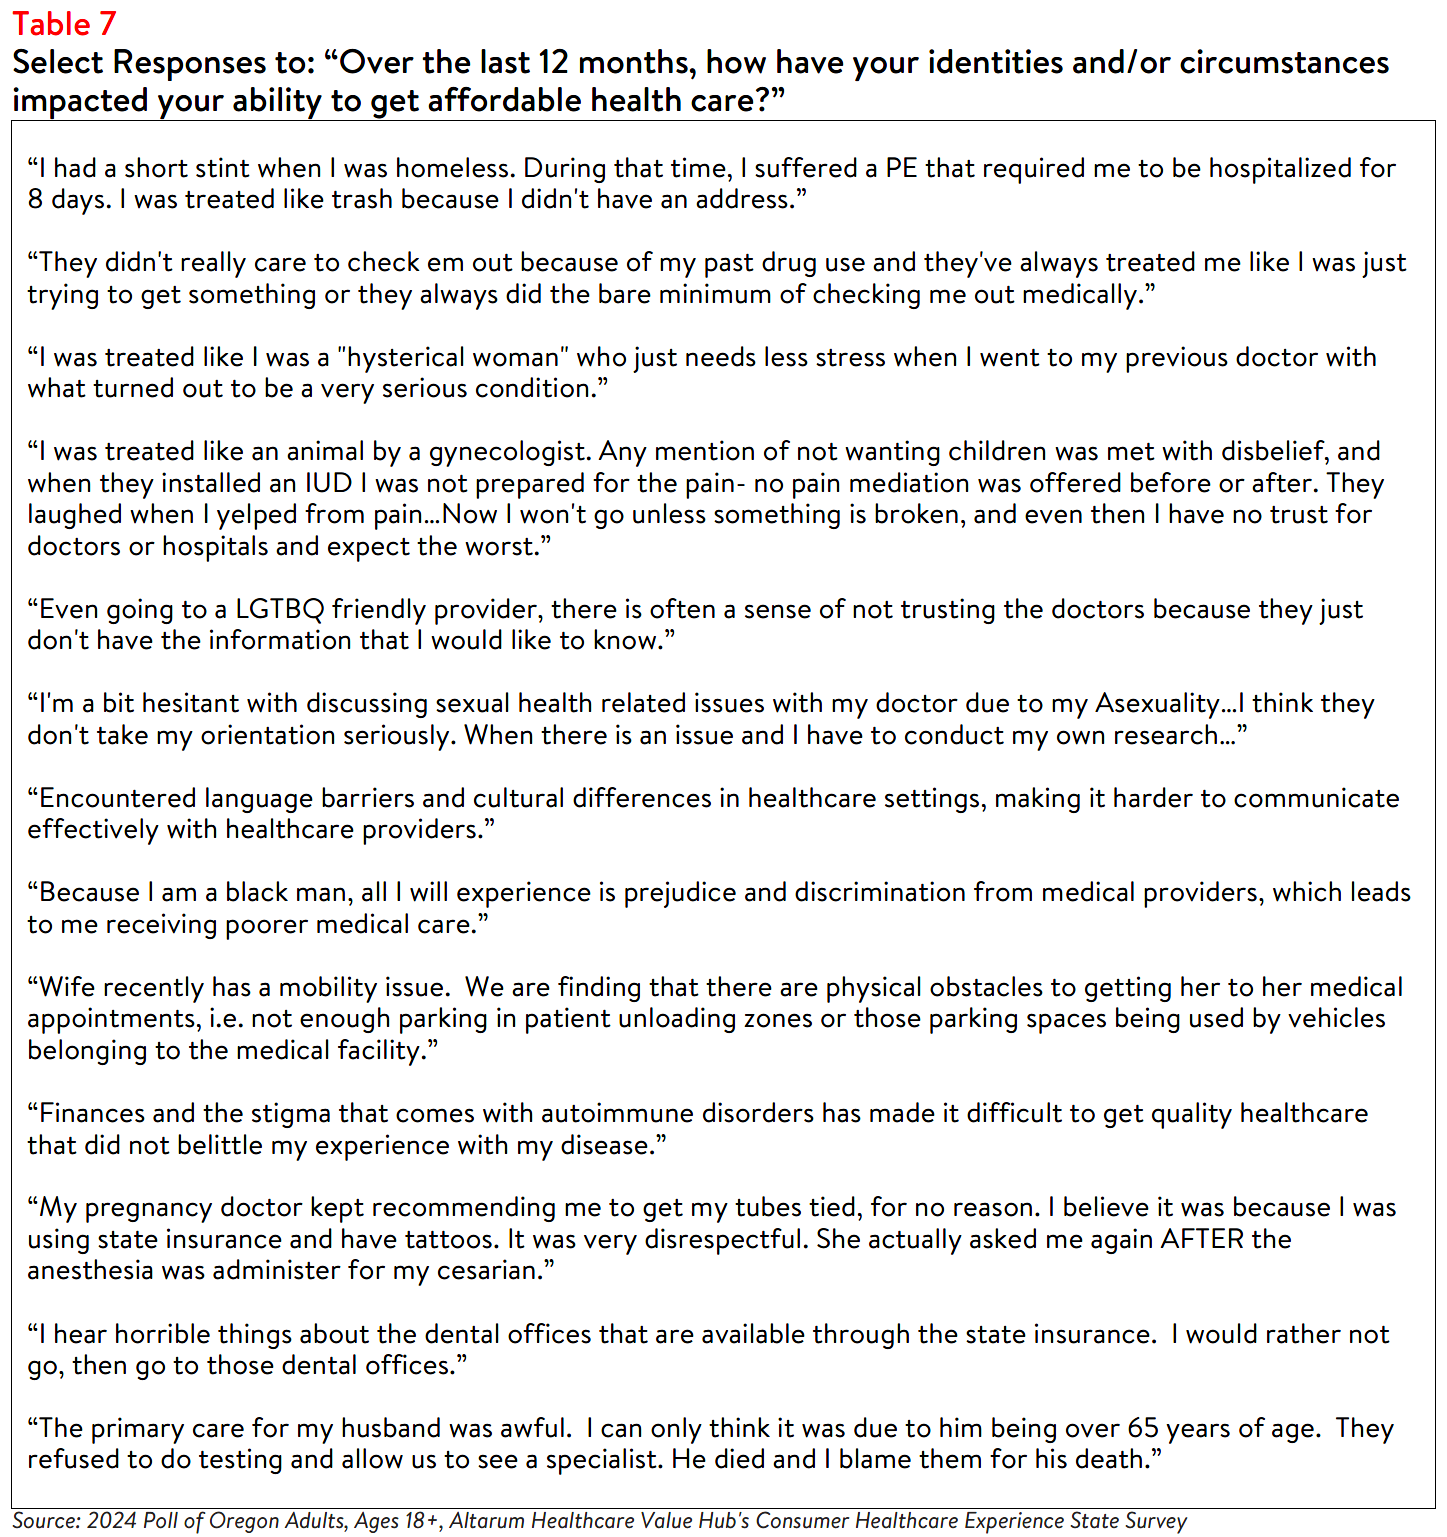
When asked to describe how their identities or circumstances have impacted their ability to get affordable
health care, many respondents offered examples of how they perceived their race, income, insurance
status, gender and ethnicity to impact their health care.
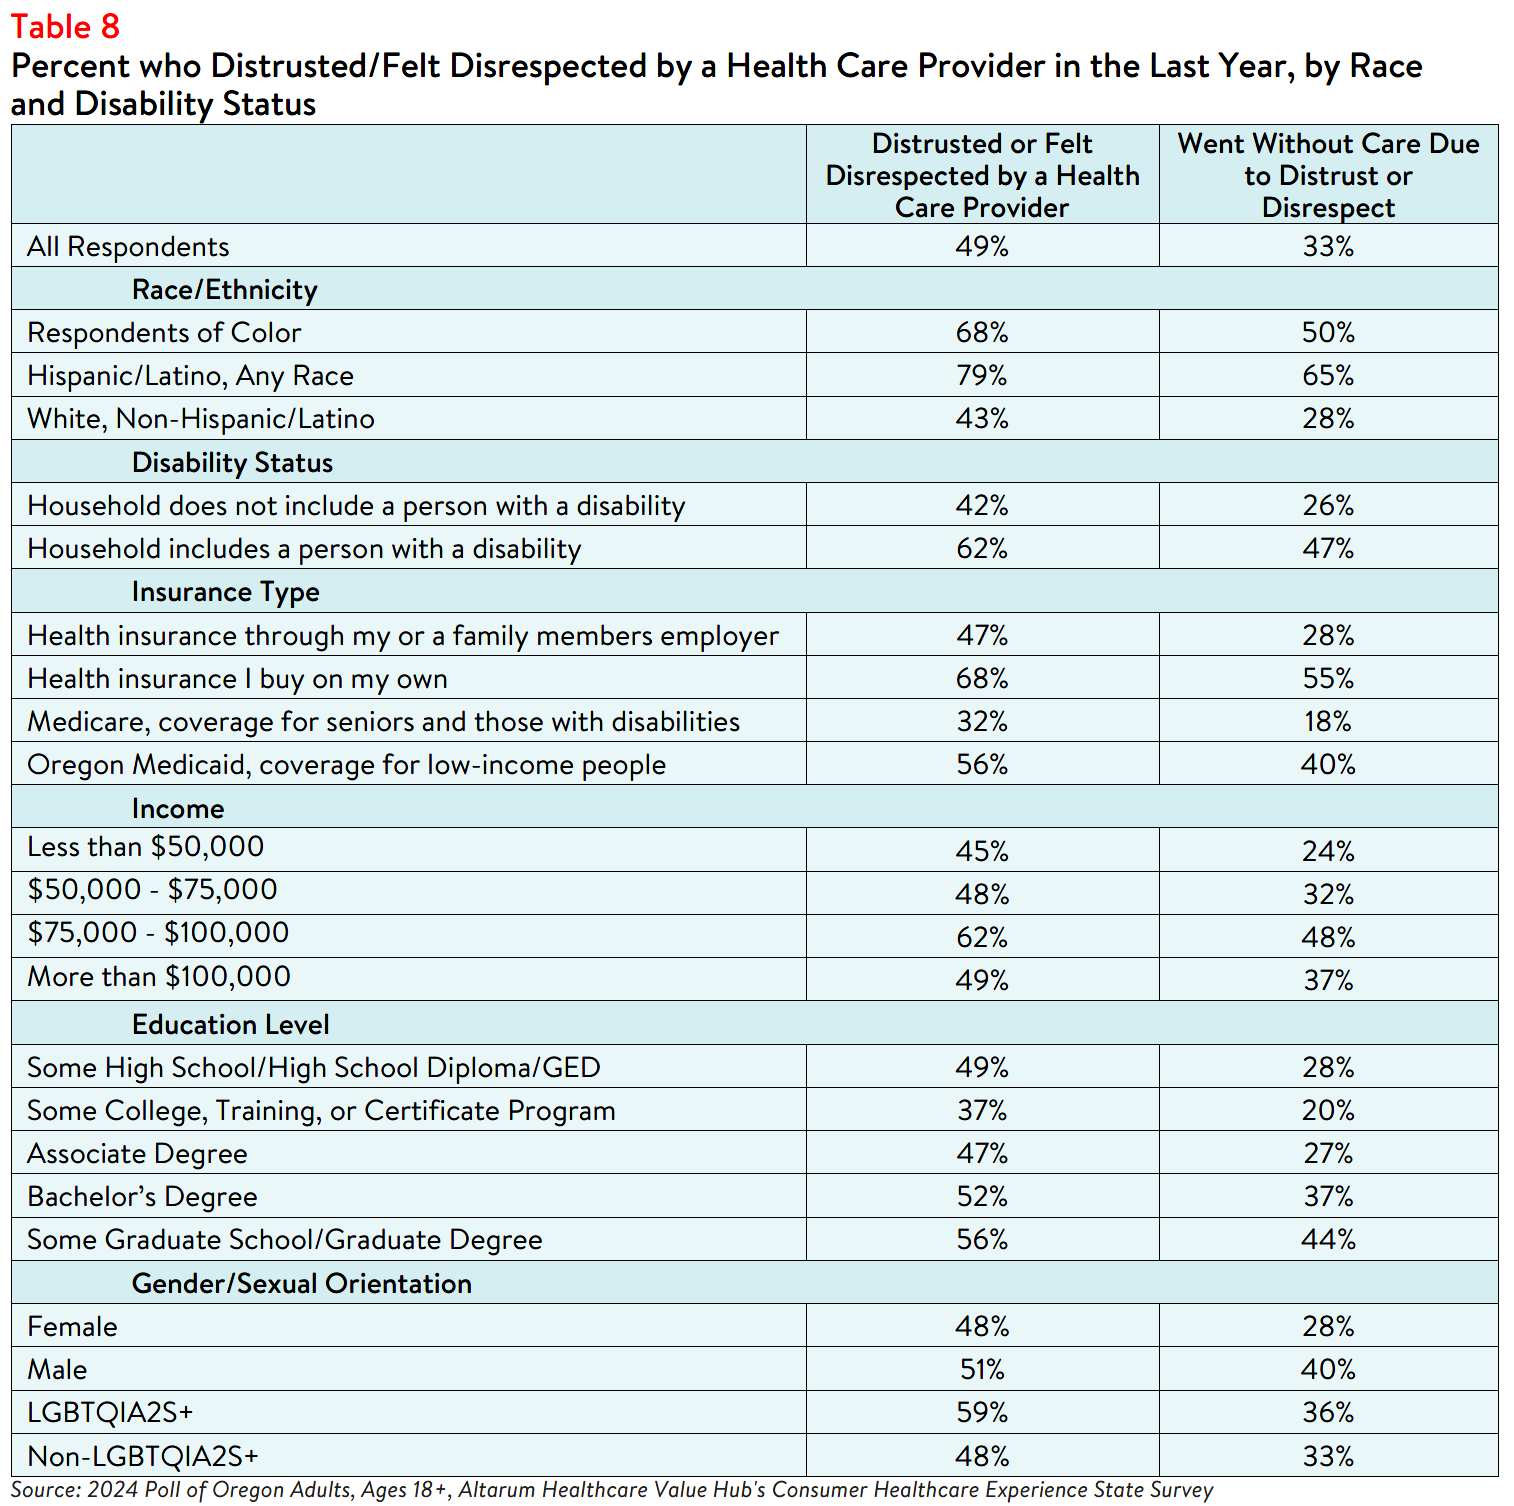
The survey also revealed differences in the frequency of respondents who reported forgoing care because they distrusted or felt disrespected by their health care provider by coverage type, income, educational attainment, gender identity, orientation, disability, race and ethnicity. For instance, 40% of respondents enrolled in Oregon Health Plan, the state Medicaid program, reported going without care due to distrust or perceived disrespect, compared to only 28% of individuals with employer-sponsored insurance (see Table 8).
Individual & Systemic Racism
Respondents believe that both individual and systemic racism exist in the U.S. health care system. Sixty-
four percent reported that they believe that people are treated unfairly by the health care system due to
their race or ethnicity either somewhat or very often. When asked what they think causes health care
systems to treat people unfairly, respondents most frequently responded with the following:
- Nearly 1 in 5 (19%) cited policies and practices built into the health care system;
- Nearly 1 in 5 (20%) cited the actions and beliefs of individual health care providers; and
- Over 2 in 5 (41%) believe it is an equal mixture of both.
Dissatisfaction with the Health System and Support for Change
Given this information, it is not surprising that 75% of Oregon respondents agree or strongly agree that
the U.S. health care system needs to change. Recognizing how the health care system disproportionately
harms some groups of people over others is key to creating a fairer and higher value system for all.
Making health care affordable for all residents is an area ripe for policymaker intervention, with
widespread support for government-led solutions across party lines. For more information on the types of
strategies Oregon residents want their policymakers to pursue, see: Oregon Residents Struggle to Afford
High Healthcare Costs; Worry about Affording Healthcare in the Future; Support Government Action across Party Lines, Healthcare Value Hub, Data Brief (August 2024).
Notes
- Fadeyi-Jones, Tomi, et al., High Prescription Drug Prices Perpetuate Systemic Racism. We Can Change It, Patients for Affordable Drugs Now (December 2020), https://patientsforaffordabledrugsnow.org/2020/12/14/drug-pricing-systemic-racism/
- Kaplan, Alan and O’Neill, Daniel, “Hospital Price Discrimination Is Deepening Racial Health Inequity,” New England Journal of Medicine—Catalyst (December 2020), https://catalyst.nejm.org/doi/full/10.1056/CAT.20.0593
- Survey participants were asked whether they have experienced any of the following due to the cost of medical bills in the past twelve months: use up all or most of their savings; sacrifice basic necessities, such as food, heat, or housing; borrow money, get a loan or take out another mortgage; use a crowdfunding platform to solicit donations; interact with a collections agency; go into credit card debt; be placed on a long-term payment plan; or declare bankruptcy.
- Raghupathi, V., Raghupathi, W., “The influence of education on health: an empirical assessment of OECD countries for the period 1995–2015,” Arch Public Health 78, 20 (2020), https://doi.org/10.1186/s13690-020-00402-5
- Suhang S., et al., “Exploring the association of paid sick leave with healthcare utilization and health outcomes in the United States: a rapid evidence review,” Global Health Journal, 7, 1 (2023), https://doi.org/10.1016/j.glohj.2023.01.002
- Miles, Angel L., Challenges and Opportunities in Quality Affordable Health Care Coverage for People with Disabilities, Protect Our Care Illinois (February 2021), https://protectourcareil.org/index.php/2021/02/26/challenges-and-
opportunities-in-quality-affordable-health-care-coverage-for-people-with-disabilities/ - As of 2024, most people with disabilities risk losing their benefits if they earn more than $1,550 a month. According to the Center for American Progress, in most states, people who receive Supplemental Security are automatically eligible for Medicaid. Therefore, if they lose their disability benefits, they may also lose their Medicaid coverage. Forbes has also reported on marriage penalties for people with disabilities, including fears about losing health insurance. See: Seervai,
Shanoor, Shah, Arnav, and Shah, Tanya, “The Challenges of Living with a Disability in America, and How Serious Illness Can Add to Them,” Commonwealth Fund (April 2019), https://www.commonwealthfund.org/publications/fund-
reports/2019/apr/challenges-living-disability-america-and-how-serious-illness-can; Fremstaf, Shawn and Valles, Rebecca, “The Facts on Social Security Disability Insurance and Supplemental Security Income for Workers with Disabilities,” Center for American Progress (May 2013), https://www.americanprogress.org/article/the-facts-on-social-
security-disability-insurance-and-supplemental-security-income-for-workers-with-disabilities/; and Pulrang, Andrew, “A Simple Fix For One Of Disabled People’s Most Persistent, Pointless Injustices,” Forbes (April 2020), https://www.forbes.com/sites/andrewpulrang/2020/08/31/a-simple-fix-for-one-of-disabled-peoples-most-persistent-pointless-injustices/?sh=6e159b946b71 - Bosworth, Arielle, et al., Health Insurance Coverage and Access to Care for LGBTQ+ Individuals: Current Trends and Key Challenges, ASPE Office of Health Policy (July 2021), https://www.aspe.hhs.gov/sites/default/files/2021-07/lgbt-health-ib.pdf
- Casanova-Perez R, Apodaca C, Bascom E, et al, “Broken down by bias: Healthcare biases experienced by BIPOC and LGBTQ+ patients,” AMIA Annu Symp Proc. 2022;2021:275-284, Published 2022 Feb 21.
- 10. Baker K., Restar A., “Utilization and Costs of Gender-Affirming Care in a Commercially Insured Transgender Population,” J Law Med Ethics, 2022;50(3):456-470, doi:10.1017/jme.2022.87
Methodology
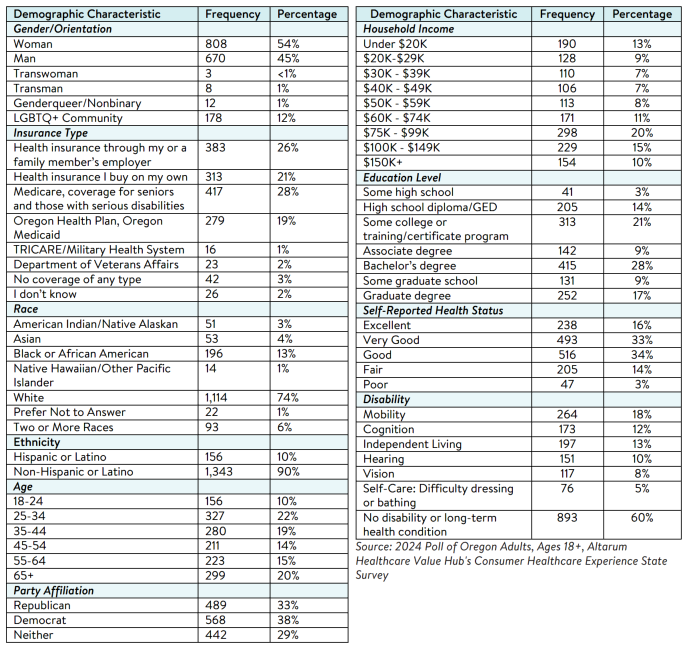
Altarum’s Consumer Healthcare Experience State Survey (CHESS) is designed to elicit respondents’ views on a wide range of health system issues, including confidence using the health system, financial burden and possible policy solutions. This survey, conducted from June 6 to June 17, 2024, used a web panel from Dynata with a demographically balanced sample of approximately 1,551 respondents who live in Oregon. Information about Dynata’s recruitment and compensation methods can be found here. The survey was conducted in English or Spanish and restricted to adults ages 18 and older. Respondents who finished the survey in less than half the median time were excluded from the final sample, leaving 1,499 cases for analysis. After those exclusions, the demographic composition of respondents was as follows, although not all demographic information has complete response rates:

Oregon Survey Results
2024
Statewide Reports
Prescription Drug Affordability
2021
Statewide Reports
Prescription Drug Affordability
Report Download
|
HEALTHCARE VALUE HUB
The Healthcare Value Hub can help you find free, timely information about policies and practices to achieve health systems that are equitable, affordable, and focused on the goals and needs of the people the system is meant to serve.
Share
![]()
![]()
![]()

Follow
![]()
![]()


![]()