Oregon Survey Respondents Worry about High Hospital Costs, Have Difficulty Estimating Quality and Cost of Care; Express Bipartisan Support for Government Action
Hospitals provide essential services and are vital to the well-being of our communities. However, a survey
of more than 1,400 Oregon adults, conducted from June 6 to June 17, 2024, revealed widespread
concern about hospital costs and bipartisan support for government-led solutions.
Hardship and Worry About Hospital Costs
Eighty-three percent (83%) of Oregon respondents reported being worried about affording health care
both now and in the future. Likewise, 43% reported experiencing a cost burden due to medical bills, and
over two in every three (61%) respondents reported being “worried” or “very worried” about affording
medical costs in the event of a serious illness or accident. These concerns may be justified — of the 18% of respondents who reported receiving an unexpected medical bill in the past year, 46% say that at least one came from a hospital.
Skills Navigating Hospital Care, Cost and Quality Information
Oregon respondents are fairly confident in their ability to recognize when to seek emergency care. Sixty-
one percent (61%) of respondents are very or extremely confident that they know when to visit the
emergency department as opposed to an urgent care center or a primary care provider. However, they
are less confident in their ability to find hospital costs and quality information. Forty-eight percent (48%)
of respondents are not confident in their ability to find the cost of a procedure in advance, and half lack
confidence in their ability to find quality ratings for doctors (49%) or hospitals (49%).
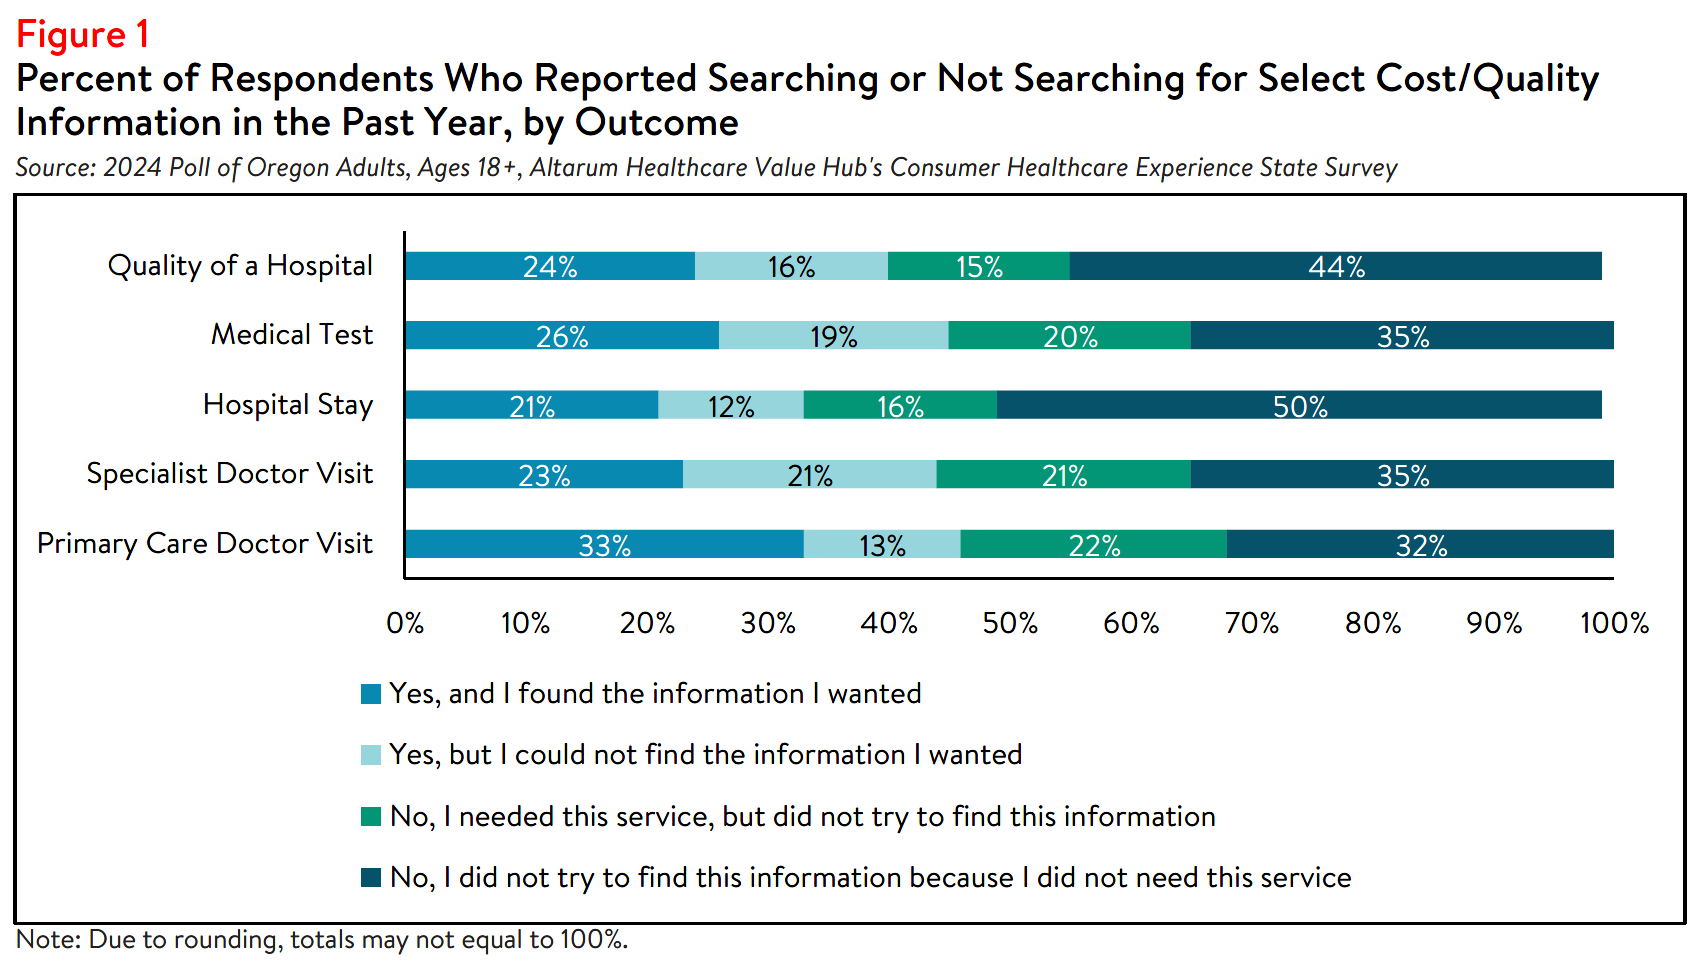
Those figures may be reflected in the low rates of searching for hospital price and quality information.
Only 33% of all respondents attempted to find the cost of a hospital stay ahead of time, and 16% needed a hospital stay but did not search for cost information (see Figure 1). Among the respondents who tried to
find hospital cost information or needed a hospital stay, 43% were able to find the information they
needed; 24% attempted to find hospital cost information but were unsuccessful; and 33% did not attempt
to find information when they needed a hospital.
Similarly, two in five (40% of) respondents reported searching for hospital quality information, and 15%
reported needing a hospital stay but not searching for quality information (see Figure 1). Of those who did
search for hospital quality information or needed a hospital stay, 43% were successful in their search; 29% searched for hospital quality information but were unsuccessful; and 27% did not attempt to find quality information despite needing a hospital stay.
Despite federal price transparency mandates for hospitals, hospital costs and quality ratings are still not
always accessible.1 This is reflected in the most frequently cited reasons respondents gave for not
searching for cost or quality information, which include:
- 31% — They followed their doctors’ recommendations or referrals;
- 27% — Looking for information felt confusing or overwhelming;
- 21% — They did not know where to look;
- 17% — It did not occur to them to look for provider quality or price information; and
- 14% — They did not have time to look.
Notably, a small number of respondents reported that cost or quality were not important to them (12%
and 5%, respectively).
Respondents who were unsuccessful in their search for hospital cost information described several
challenges. Thirty-six percent (36%) reported that the available cost information was confusing; 35%
reported that their insurer would not provide a price estimate; 27% reported that their provider or
hospital would not provide a price estimate; and 29% reported that the price information was insufficient.
Likewise, among respondents who were unsuccessful in their search for hospital quality information, 30%
reported that the resources were confusing, and 19% reported that the quality information was not
sufficient.
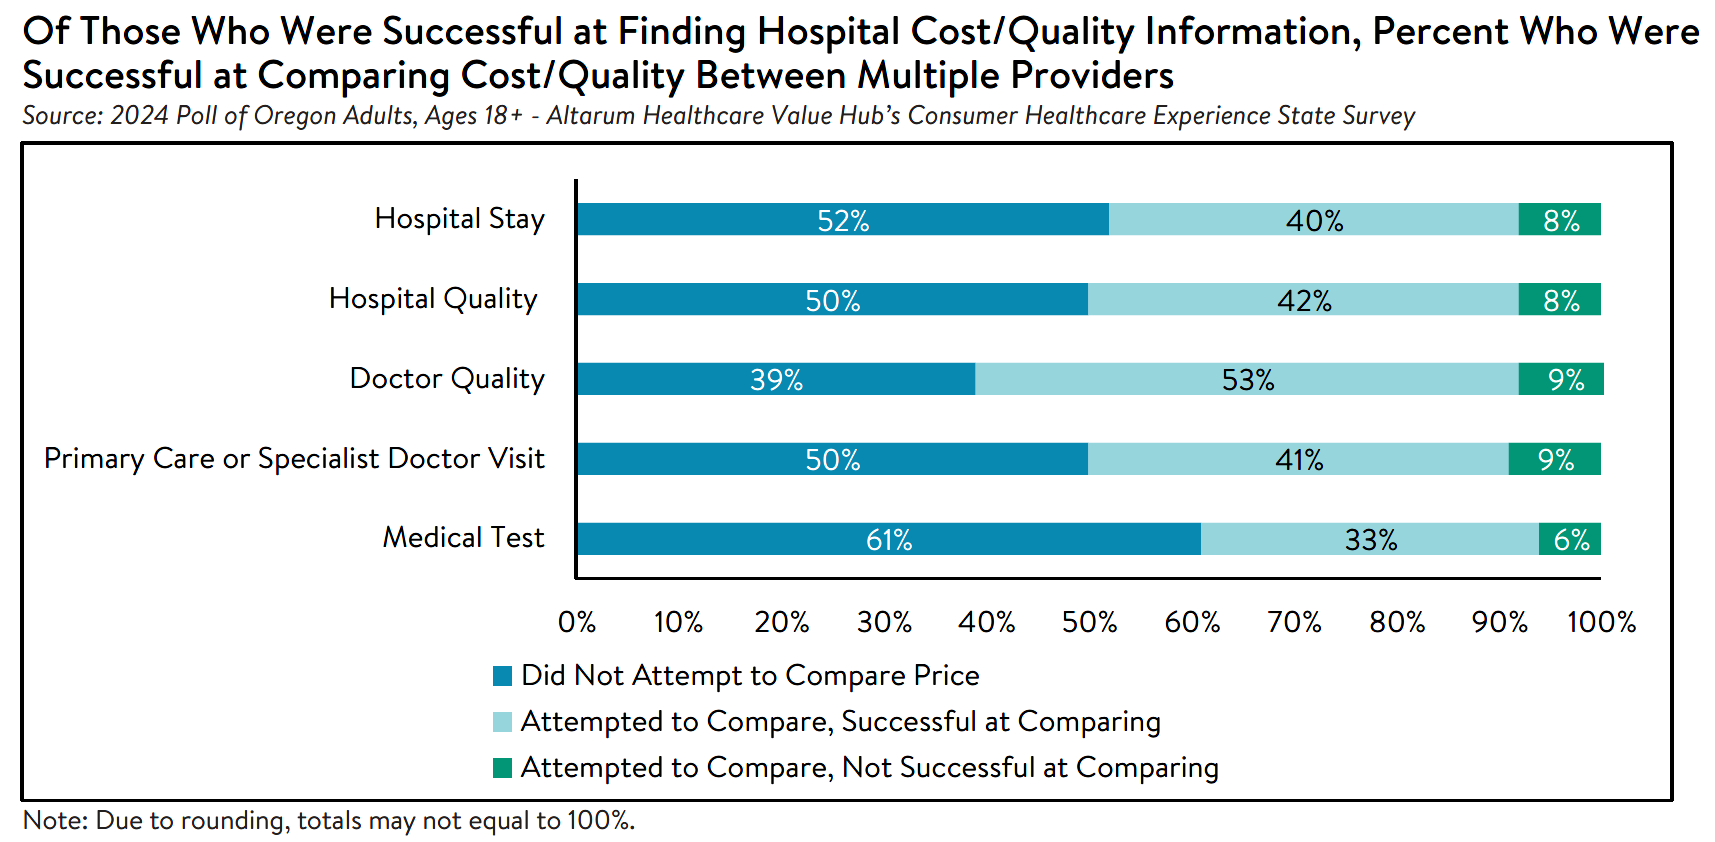
However, among those who were successful in their search for cost or quality information, 40% reported
they were able to find enough information to successfully compare the costs of a hospital stay between
two or more options, and 42% reported finding enough information to compare quality ratings across
hospitals (see Figure 2). Many of these respondents reported that the comparison ultimately influenced
their choice of which provider to seek care from. Eighty-one percent (81%) of respondents who compared
the cost of a primary care or specialist doctor visit, 79% of those who compared the cost of medical test
providers and 81% of those who compared the cost of a hospital stay reported that the comparison
influenced their choice of hospital or provider. Likewise, 87% of respondents who searched for hospital
quality information reported that the comparison influenced their decision of hospital.
Figure 2
Impact of and Worry Related to Hospital Consolidation*
In addition to the above healthcare affordability burdens, a small share of Oregon respondents reported
being negatively impacted by health system consolidation. In 2018, there was 1 change in ownership
involving hospitals through mergers, acquisitions, or CHOW in Oregon.2,3
Oregon requires that the State Attorney General and Oregon Health Authority be notified of nonprofit
hospital transactions but does not grant the authority to approve or deny transactions.4
In the past year, 35% of respondents reported that they were aware of a merger or acquisition in their
community—of those respondents, 30% reported that they or a family member were unable to access
their preferred health care organization because of a merger that made their preferred organization out-
of-network. Out of those who reported being unable to access their preferred healthcare provider due to
a merger:
- 40% — changed their preferred doctor or hospital to one that is in-network;
- 31% — skipped recommended follow-up visits due to a merger;
- 30% — skipped filling a prescription medication;
- 26% — delayed or avoided going to the doctor or having a procedure done because they could no longer access their preferred health care organization due to a merger;
- 22% — changed their health plan coverage to include the preferred doctor or hospital;
- 14% — have switched to telehealth options to continue seeing their preferred provider;
- 9% —stayed with their preferred health care provider and now pay out-of-network prices; and
- 3% — have changed their preferred provider due to a merger resulting in a service closure.
Out of those who reported that the merger caused an additional burden for them or their families, the top
three most frequently reported issues were:
- 27% — The merger created an added wait time when searching for a new provider;
- 20% — The merger created a gap in the continuity of my care;
- 20% — it has created an added transportation burden; and
- 18% — The merger created an added financial burden.
While a smaller portion of respondents reported being unable to access their preferred health care
organization because of a merger, more respondents (66%) reported being somewhat, moderately, or
very worried about the impacts of mergers in their health care organizations. When asked about their
largest concern respondents most frequently reported:
- 29% — I’m concerned I will have to pay more to see my doctor;
- 25% — I’m concerned I will have fewer choices of where to receive care;
- 25% — I’m concerned my doctor may no longer be covered by my insurance;
- 13% — I’m concerned I will have a lower quality of care; and
- 8% — I’m concerned I will have to travel farther to see my doctor.
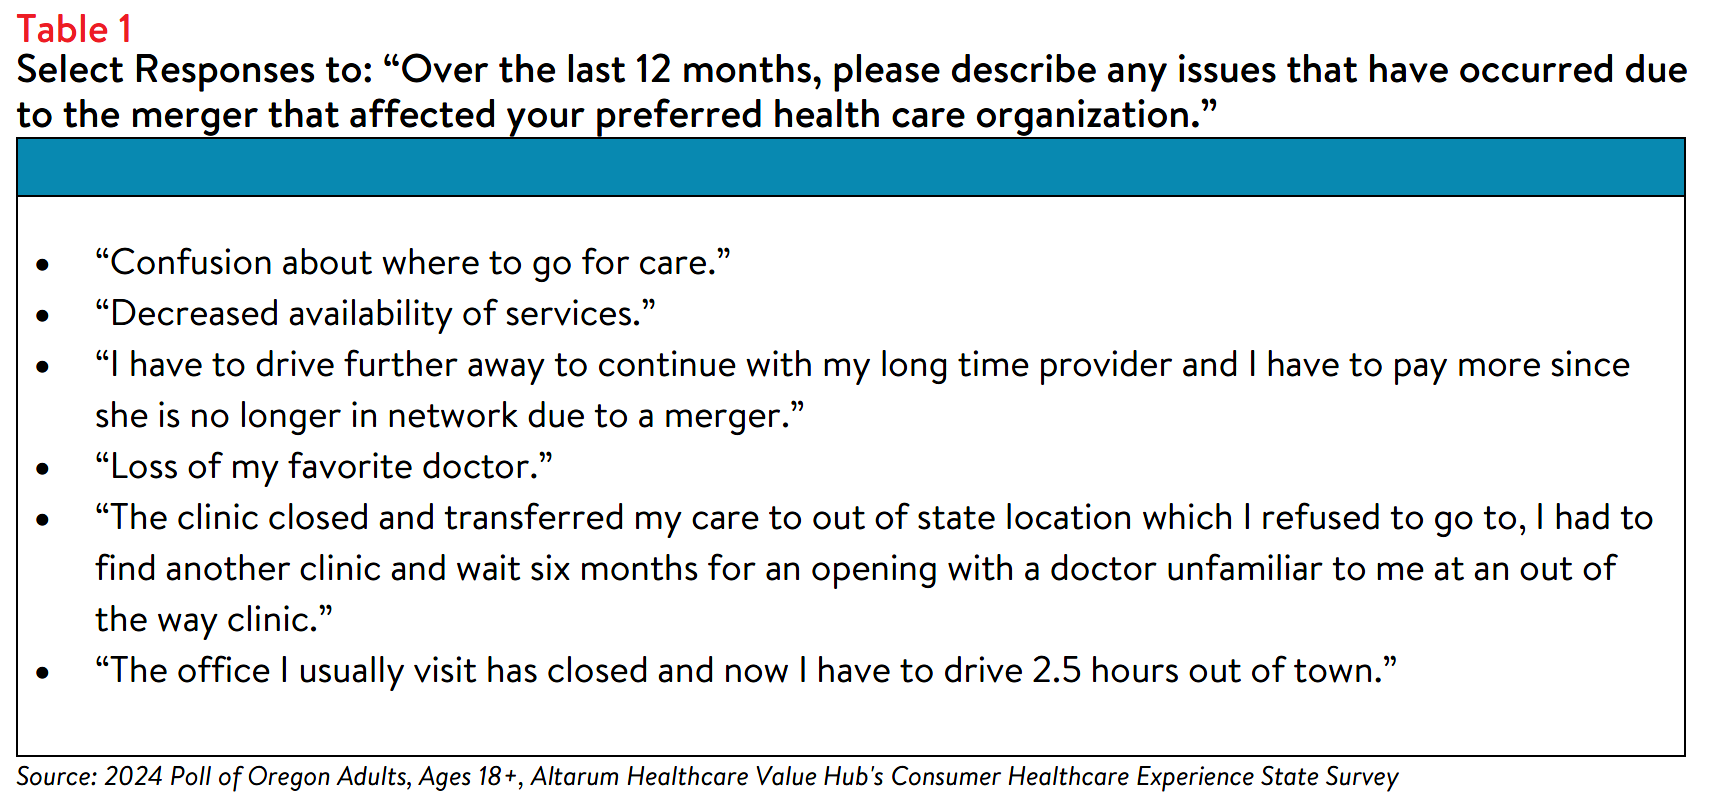
To ascertain additional information on the specific ways that health system consolidation impacts Oregon
residents, survey respondents were asked to share their experiences following hospital consolidation (see
Table 1).
Support for Solutions Across Party Lines
Hospitals, along with drug manufacturers and insurance companies, are viewed as a primary contributor to high health care costs. Out of fifteen possible options, Oregon respondents most frequently reported
believing that the reason for high health care costs is unfair prices charged by powerful industry
stakeholders, such as:
- 70% — Drug companies charging too much money
- 65% — Insurance companies charging too much money
- 64% — Hospitals charging too much money
- 49% — Large hospitals or physician groups using their influence to increase payments from insurance companies
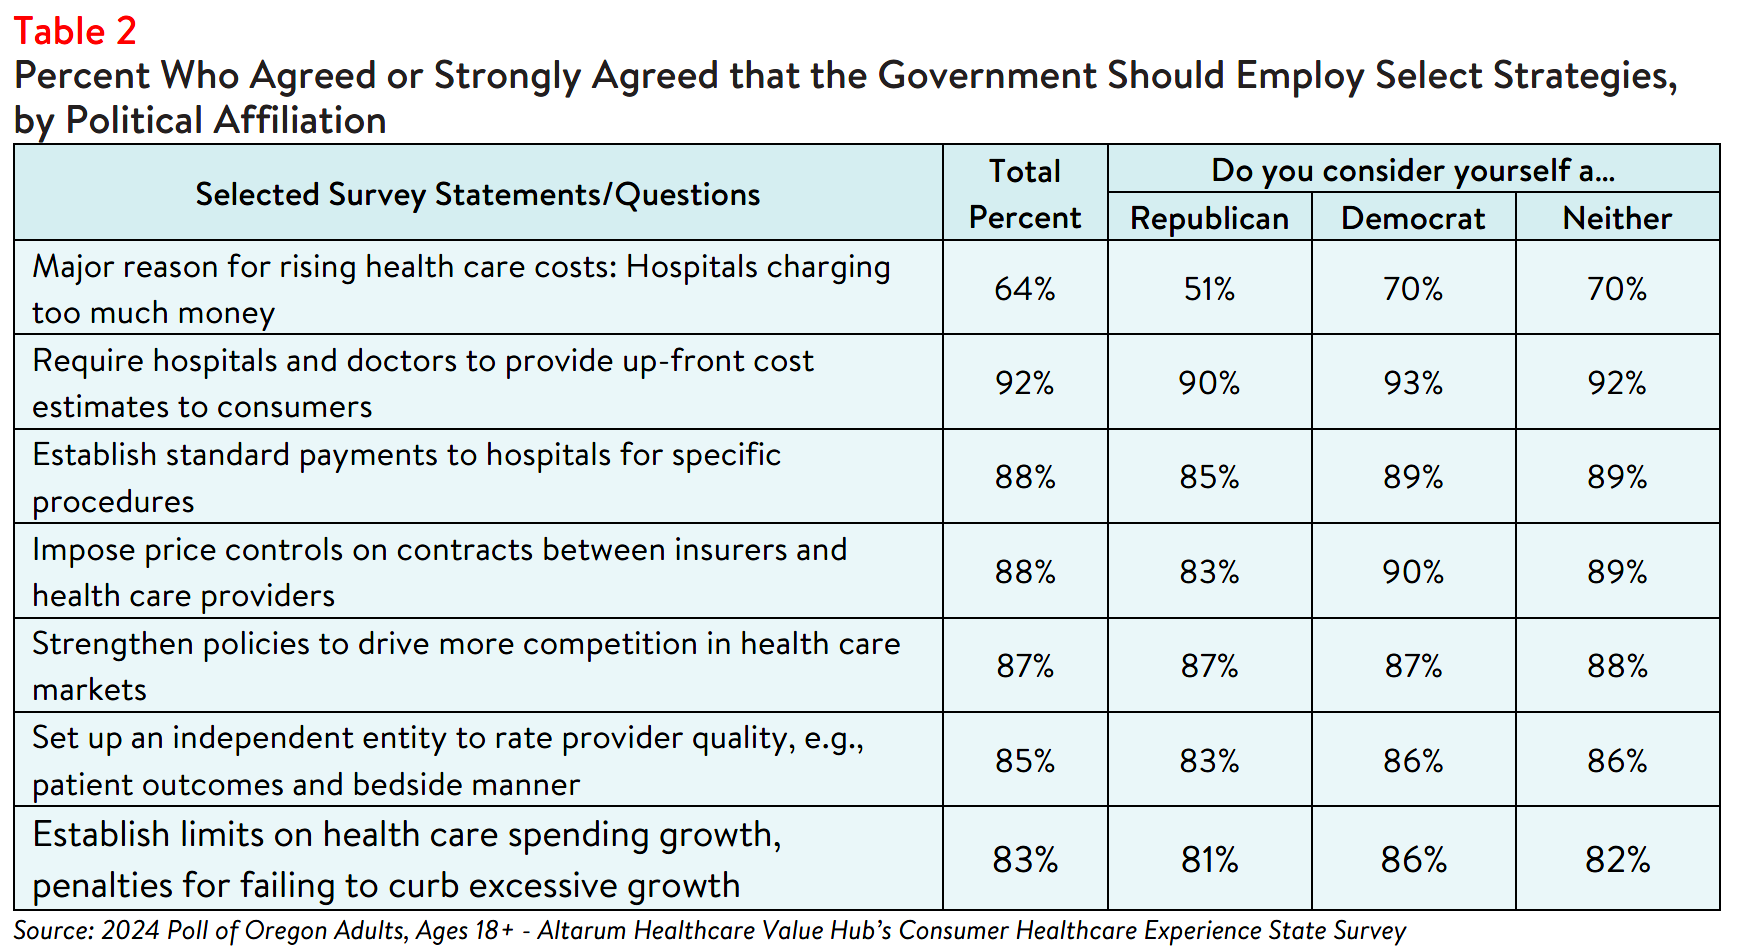
Respondents endorsed a number of strategies to address high health care costs, including:
- 92% — Require hospitals and doctors to provide up-front cost estimates to consumers;5
- 88% — Set standard payments to hospitals for specific procedures;
- 88% — Impose price controls on contracts between insurers and health care providers;
- 87% — Strengthen policies to drive more competition in health care markets; and
- 85% — Establish an independent entity to rate doctor and hospital quality.
Conclusion
The poll findings indicate that while some Oregon respondents are motivated to search for hospital cost
and quality information to inform their decisions and plan for future medical expenses, depending on
service type, 15-22% did not seek this information at all when they needed a service, and 39-61% of those who did find cost or quality information did not compare prices. This suggests that price transparency initiatives alone may not effectively influence consumer behavior. Lack of knowledge of hospital quality and potential costs may impede residents’ ability to plan for needed care and budget for the expense of a hospital stay, which can be costly, particularly for residents who are uninsured or under-insured.5
Oregon respondents support government-led solutions to make price and quality information more
accessible and to help consumers navigate hospital care. Many favored solutions would reduce the burden on consumers, such as standardizing payments for specific procedures, requiring cost estimates from hospitals and doctors, and establishing an independent entity for quality reviews. Policymakers should consider these and other policy options to address the bipartisan call for government action.
Notes
-
As of January 1, 2021, the Centers for Medicare and Medicaid Services (CMS) requires hospitals to make public a
machine-readable file containing a list of standard charges for all items and services provided by the hospital, as well as a consumer-friendly display of at least 300 shoppable services that a patient can schedule in advance. However, Compliance from hospitals has been mixed, indicating that the rule has yet to demonstrate the desired effect. https://www.healthaffairs.org/content/forefront/hospital-price-transparency-progress-and-commitment-achieving-its-potential -
Centers for Medicare and Medicaid Services. (2023). Hospital Change of Ownership. Retrieved June 5, 2024, from
https://data.cms.gov/provider-characteristics/hospitals-and-other-facilities/hospital-change-of-ownership. -
A CHOW typically occurs when a Medicare provider has been purchased (or leased) by another organization. The CHOW results in the transfer of the old owner's identification number and provider agreement (including any Medicare outstanding debt of the old owner) to the new owner…An acquisition/merger occurs when a currently enrolled Medicare provider is purchasing or has been purchased by another enrolled provider. Only the purchaser's CMS Certification Number (CCN) and tax identification number remain. Acquisitions/mergers are different from CHOWs. In the case of an acquisition/merger, the seller/former owner's CCN dissolves. In a CHOW, the seller/former owner's CCN typically remains intact and is transferred to the new owner. A consolidation occurs when two or more enrolled Medicare providers consolidate to form a new business entity. Consolidations are different from acquisitions/mergers. In an acquisition/merger, two entities combine but the CCN and tax identification number (TIN) of the purchasing entity remains intact. In a consolidation, the TINs and CCN of the consolidating entities dissolve and a new TIN and CCN are assigned to the new, consolidated entity. Source: Missouri Department of Health and Senior Services, Change of Ownership Guidelines—Medicare/State Certified Hospice. Retrieved August 23, 2023, from
https://health.mo.gov/safety/homecare/pdf/CHOW-Guidelines-
StateLicensedHospice.pdf#:~:text=Acquisitions%2Fmergers%20are%20different%20from%20CHOWs.%20In%20the%2
0case,providers%20consolidate%20to%20form%20a%20new%20business%20entity. -
The Source on Health Care Price and Competition, Merger Review, Retrieved July 9, 2024 from https://sourceonhealthcare.org/market-consolidation/merger-review/
-
According to Health Forum, an affiliate of the American Hospital Association, hospital adjusted expenses per inpatient day in Oregon were $4,003 in 2022. See: Kaiser Family Foundation, State Health Facts Data: Hospital AdjustedExpenses per Inpatient Day. Accessed June 28, 2024. https://www.kff.org/health-costs/state-indicator/expenses-per-inpatient-day/
Methodology
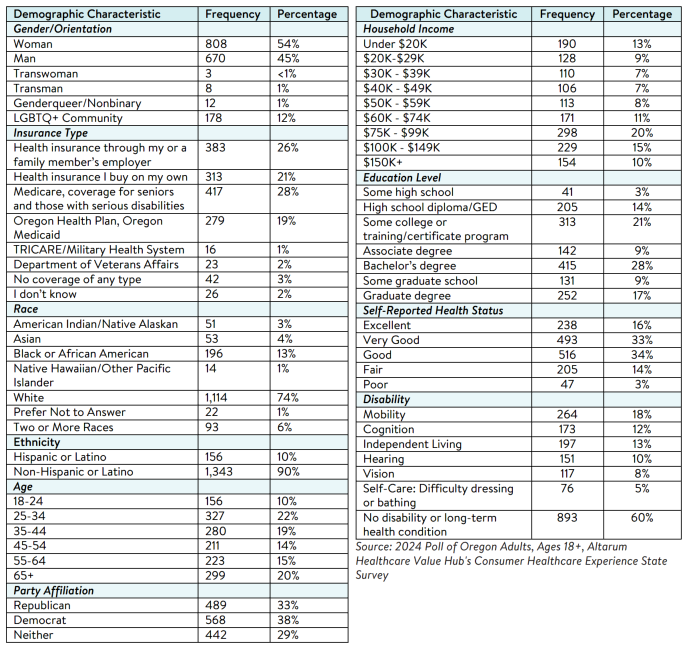
Altarum’s Consumer Healthcare Experience State Survey (CHESS) is designed to elicit respondents’ views on a wide range of health system issues, including confidence using the health system, financial burden and possible policy solutions. This survey, conducted from June 6 to June 17, 2024, used a web panel from Dynata with a demographically balanced sample of approximately 1,551 respondents who live in Oregon. Information about Dynata’s recruitment and compensation methods can be found here. The survey was conducted in English or Spanish and restricted to adults ages 18 and older. Respondents who finished the survey in less than half the median time were excluded from the final sample, leaving 1,499 cases for analysis. After those exclusions, the demographic composition of respondents was as follows, although not all demographic information has complete response rates:

Oregon Survey Results
2024
Statewide Reports
Prescription Drug Affordability
2021
Statewide Reports
Prescription Drug Affordability
Report Download
|
HEALTHCARE VALUE HUB
The Healthcare Value Hub can help you find free, timely information about policies and practices to achieve health systems that are equitable, affordable, and focused on the goals and needs of the people the system is meant to serve.
Share
![]()
![]()
![]()

Follow
![]()
![]()


![]()