Rhode Island Survey Respondents Bear Health Care Affordability Burdens Unequally; Distrust of/Disrespect by Health Care Providers Leads Some to Delay/Go Without Needed Care
Key Findings
A survey of more than 1,000 Rhode Island adults, conducted from March 26 to April 12, 2024, found
that:
- Nearly seven out of ten (69%) Rhode Island respondents have experienced one or more health care affordability burdens in the past 12 months. Four in five (82%) worry about affording some aspect of health care now or in the future.
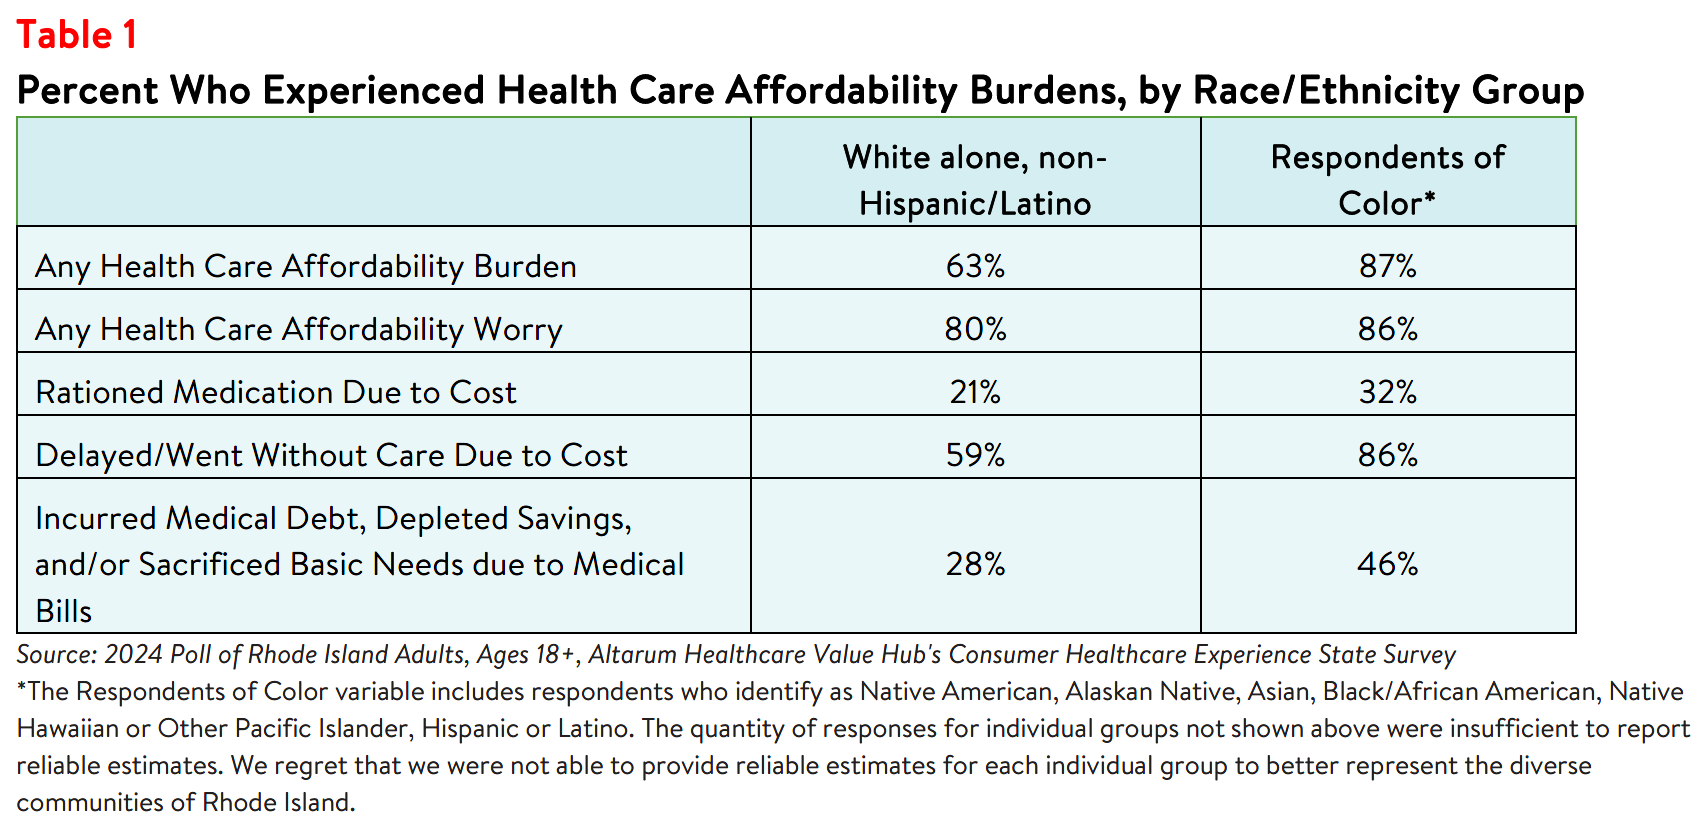
- Respondents of color experienced greater affordability burdens than their white alone, non-Hispanic counterparts: 87% of respondents of color have experienced one or more health care affordability burdens in the past 12 months, compared to 63% of white alone, non-Hispanic respondents.
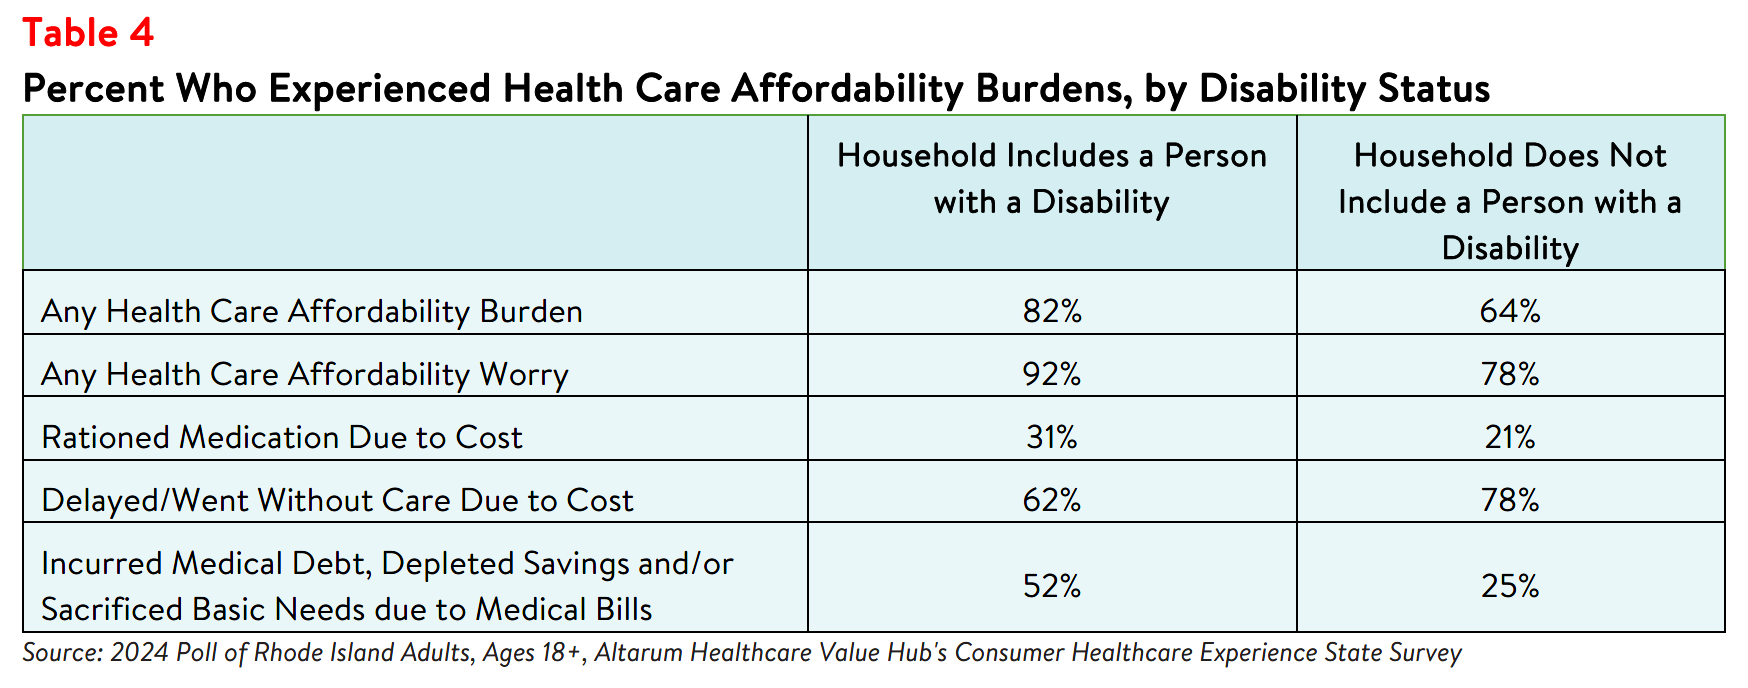
- Respondents living in households with a person with a disability more frequently reported affordability burdens than respondents without a disabled household member, including: rationing medication due to cost (31% versus 21%); delaying or going without care due to cost (78% versus 62%); and going into medical debt, depleting savings, or sacrificing basic needs due to medical bills (52% versus 25%).
- Thirty percent of respondents of color skipped needed medical care due to distrust of or feeling disrespected by health care providers, compared to 12% of white alone, non-Hispanic respondents.
- Sixty percent of all respondents think that people are treated unfairly based on their race or ethnic background somewhat or very often in the U.S. health care system.
Difference in Affordability Burdens & Concerns
Race
The intersection of racial disparities in health care and affordability issues impact access to care and may
contribute to financial burdens for communities of color, particularly Black and Hispanic/Latino
communities.1,2 In Rhode Island, respondents of color reported higher rates of some affordability burdens
than white alone, non-Hispanic/Latino respondents, including incurring medical debt, depleting savings, or
sacrificing basic needs (like food, heat, and housing) due to medical bills (see Table 1).
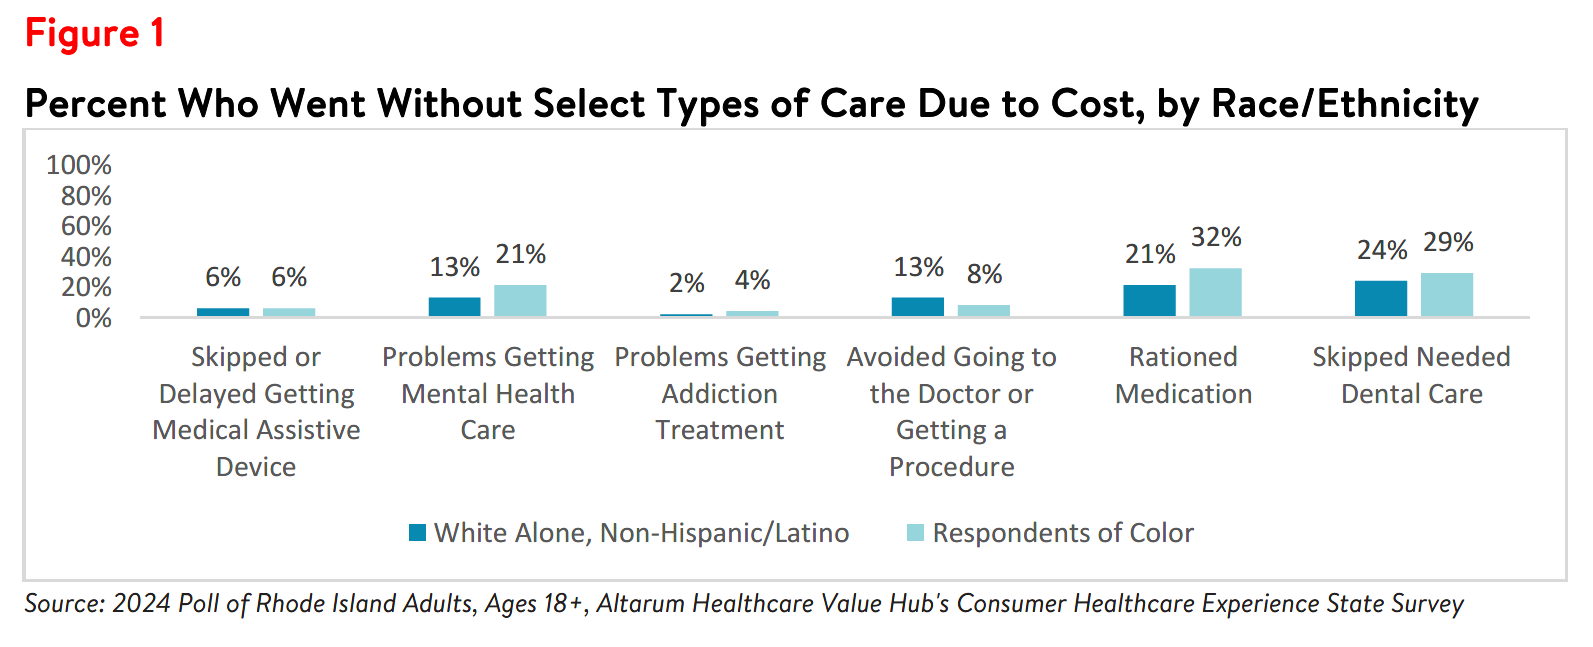
In addition to incurring medical debt, respondents of color more frequently reported difficulty getting select
types of care compared to white alone, non-Hispanic respondents (see Figure 1).3
Income and Education
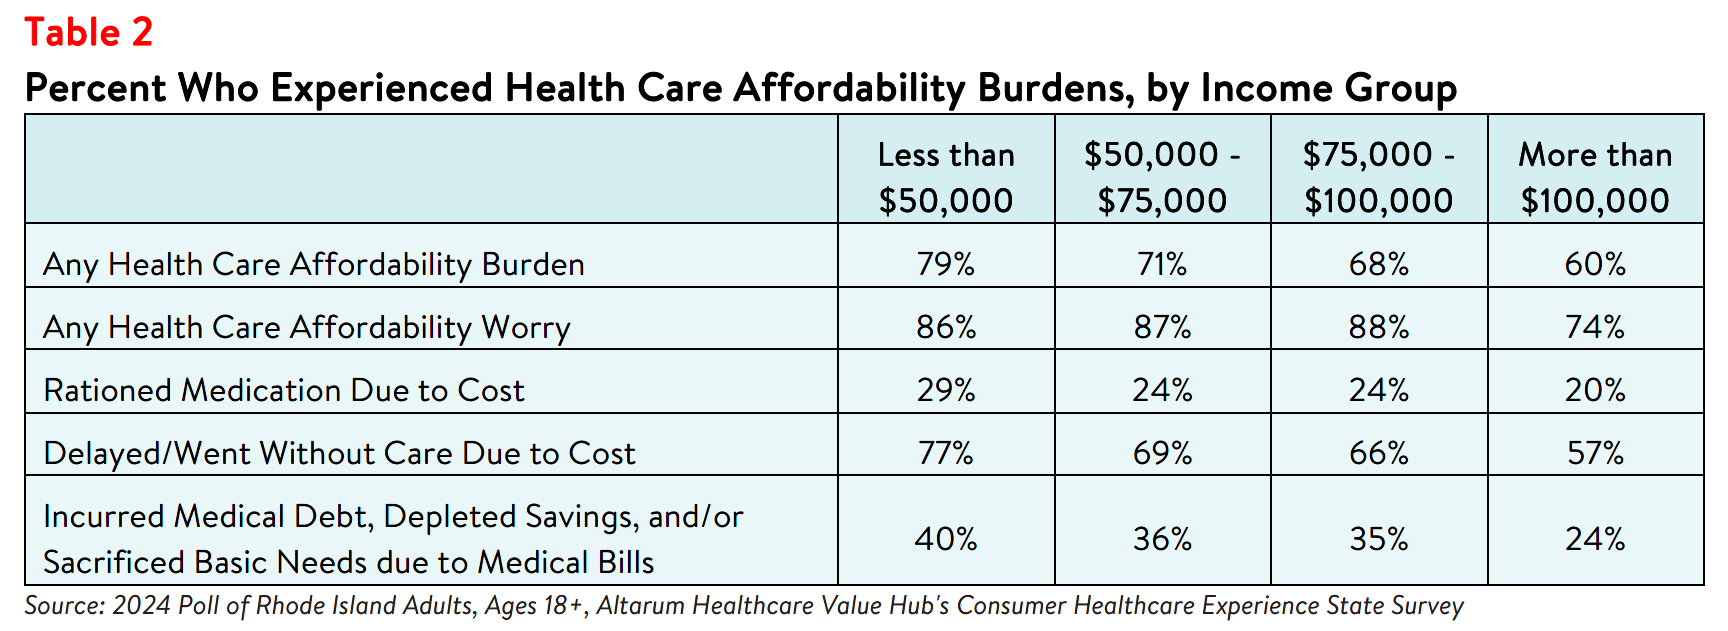
The survey also revealed differences in how Rhode Island respondents experience health care affordability burdens by income and education levels. Respondents at the lowest end of the income spectrum most frequently reported affordability burdens, with over three-fourths (79%) of those with household incomes of less than $50,000 per year struggling to afford health care in the past 12 months (see Table 2). Still, over half of respondents living in middle- and high-income households also reported struggling to afford some aspect of coverage or care, demonstrating that affordability burdens impact people all income groups. Likewise, at least 74% of respondents in each income group reported being worried about affording health care either now or in the future.
Additionally, greater than one-quarter (29%) of respondents with household incomes of $50,000 or less
reported not filling a prescription, skipping doses of medicines, or cutting pills in half due to cost. Lower-
income respondents also most frequently reported financial consequences after receiving health care
services—40% of respondents who earned less than $50,000 a year either went into medical debt,
depleted their savings, or sacrificed other basic needs (like food, heat, or housing) due to medical bills,
compared to 24% of those earning over $100,000.
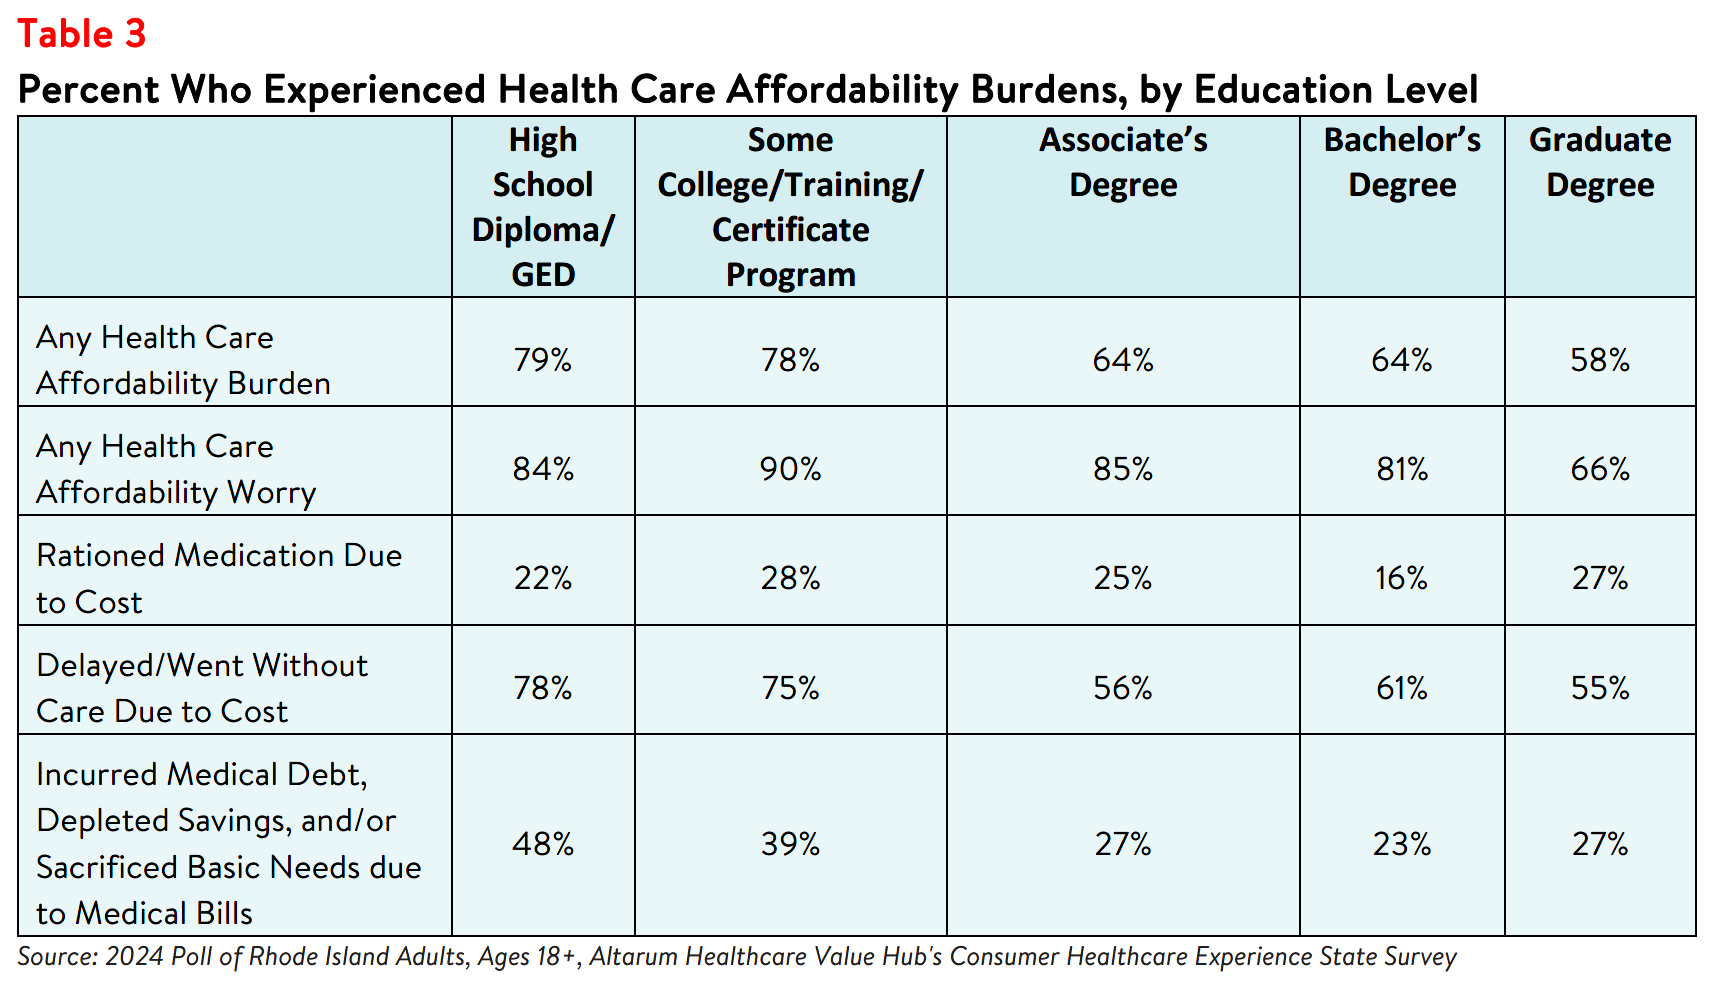
As education and income are closely related4, it is not surprising that affordability burdens experienced by
respondents with lower education levels are similar to those experienced by those with lower incomes
(see Table 3). Still, many of those with higher levels of education experienced affordability burdens and
worries.
Disability Status
People with disabilities interact with the health care system more often than those without disabilities, and
as a result, tend to face more out-of-pocket costs.5 Additionally, people who receive disability benefits
face unique coverage challenges that impact their ability to afford needed care, such as the possibility of
losing coverage if their household income or assets increase over a certain amount (for example, after
getting married).6 Rhode Island respondents who have or live with a person who has a disability more
frequently reported a diverse array of affordability burdens compared to others (see Table 4). These
respondents also more frequently reported worrying about future health care affordability in general
(78% versus 92%) and losing health insurance specifically (42% versus 24%).
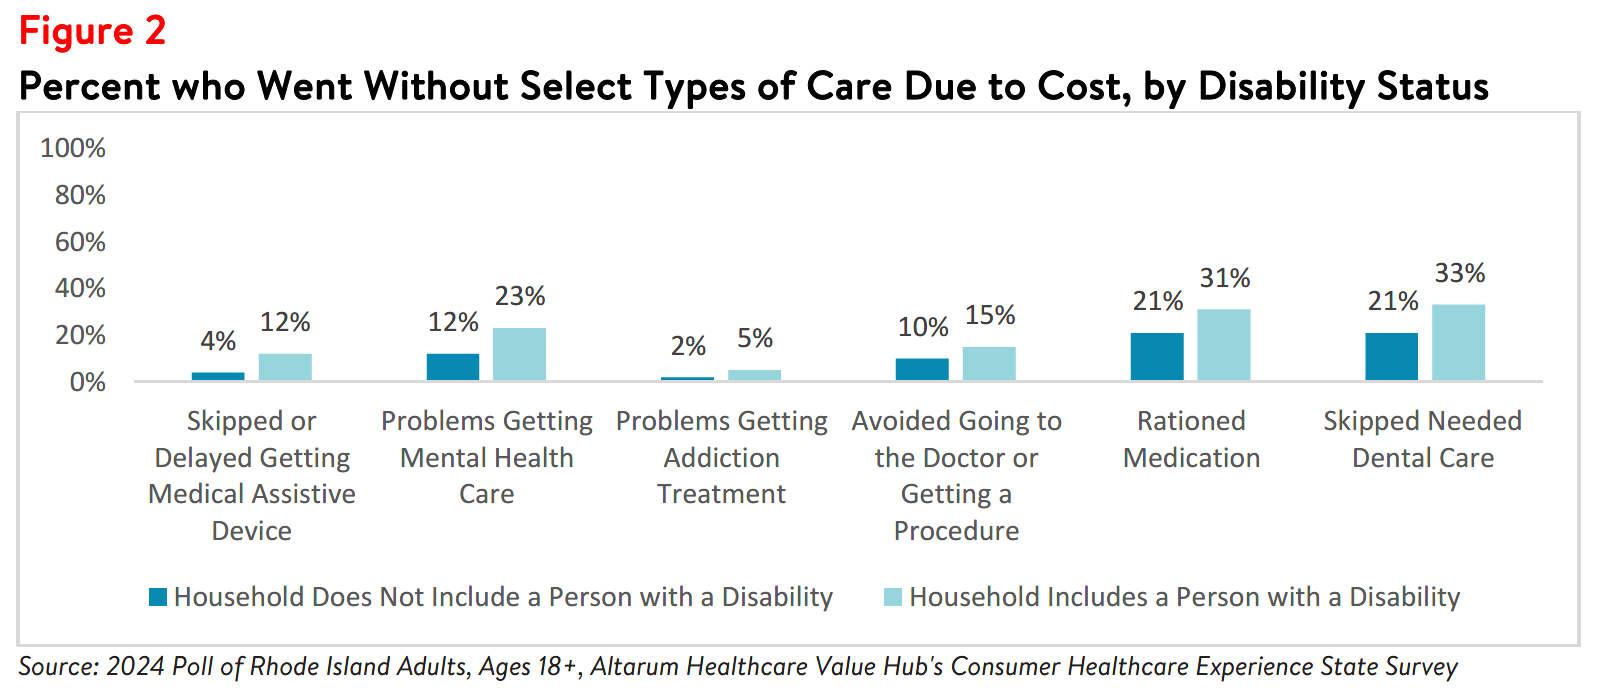
Those with disabilities also face health care affordability burdens unique to their disabilities—12% of
respondents reporting a disability in their household delayed getting a medical assistive device such as a
wheelchair, cane/walker, hearing aid, or prosthetic limb due to cost. Just 4% of respondents without a
disability (who may have needed such tools temporarily or may not identify as having a disability) reported
this experience (see Figure 2). Similarly, 23% of respondents reporting a disability in their household
reported problems getting mental health care compared to 12% of households without a person with a
disability.
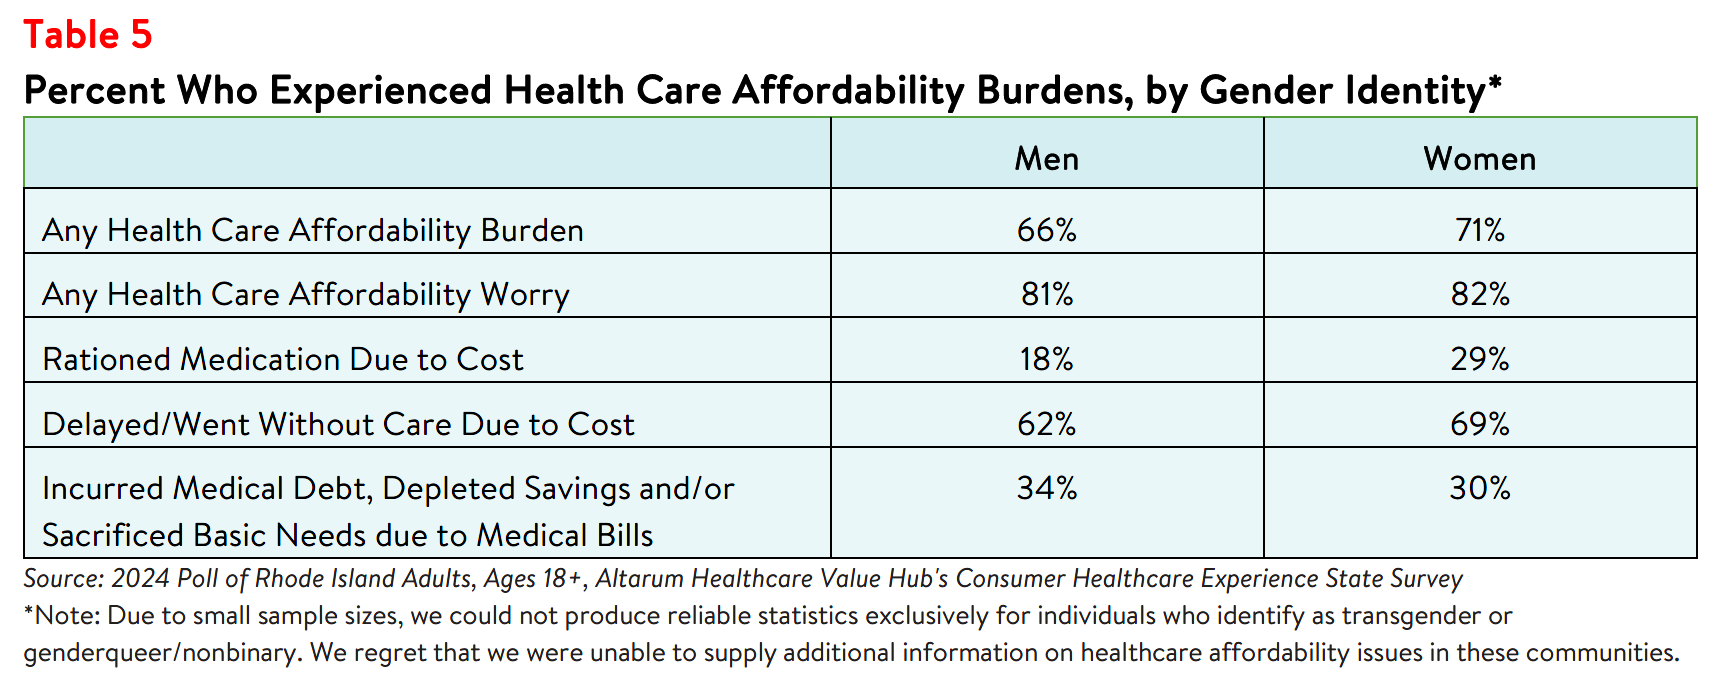
Gender and Sexual Orientation
The survey also surfaced differences in health care affordability burdens and worries by gender and sexual orientation. Women who responded to the survey reported higher rates of experiencing at least one affordability burden in the past year than men (71% versus 66%) (see Table 5). Women also more
frequently reported delaying or going without care due to cost in general and reported higher rates of
rationing their medications by not filling a prescription, skipping doses, or cutting pills in half. While many
respondents regardless of gender reported being somewhat or very concerned about health care costs, a
higher percentage of women reported worrying about affording some aspect of coverage or care than
men (82% versus 81%).
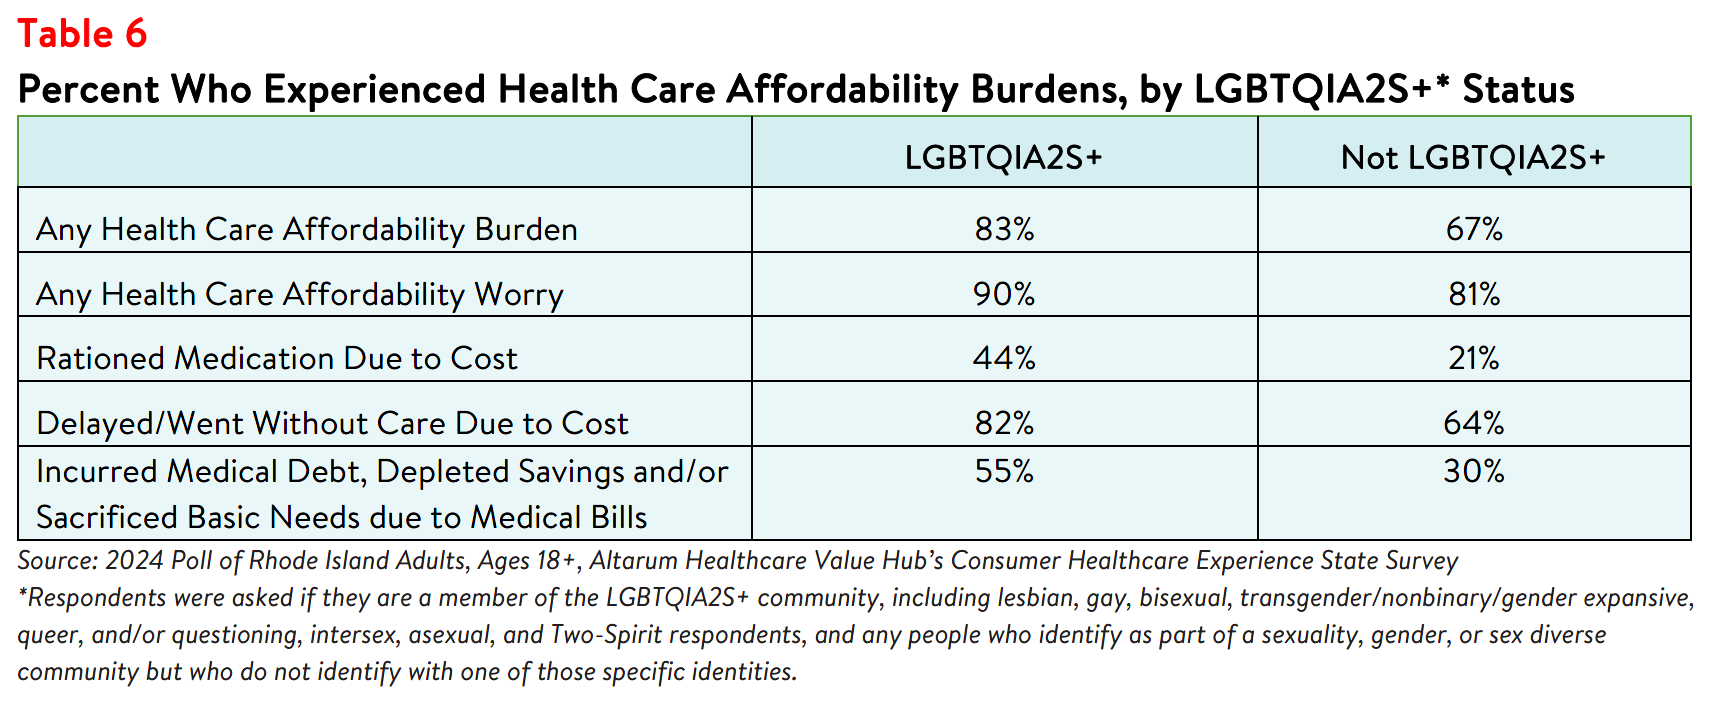
In addition, the survey found that LGBTQIA2S+ respondents experienced affordability burdens more
frequently than respondents who were not (see Table 6).
Distrust and Mistrust in the Health System
Whether a patient trusts and/or feels respected by their health care provider may impact whether they
seek needed care. In Rhode Island, about 1 in 4 (24% of) respondents reported that their provider never,
rarely, or only sometimes treats them with respect. When asked why they felt health care providers did
not treat them with respect, over one-third of these respondents cited their income or financial status
(39%), followed by race (27%), disability (20%), ethnic background (18%), gender/gender identity (17%),
and education level (15%). In lesser numbers, respondents cited experience with violence or abuse (7%),
sexual orientation (8%), and religion (7%) as reasons for the disrespect.
Respondents of color, those who identify as part of the LGBTQIA2S+ community, those who earn less
than $50,000 per year, those who have a high school diploma/GED, and those with a person with a
disability in their household more frequently reported distrust in and feeling disrespected by their health
care providers compared to white respondents, those with higher annual incomes, higher education levels, those who do not identify with the LGBTQIA2S+ community, and those without a disabled household member (see Table 7). They also more frequently went without medical care due to that distrust and/or disrespect.
Overall, 30% of respondents of color reported going without needed medical care due to distrust of or
feeling disrespected by health care providers, compared to only 12% of white, non-Hispanic respondents.
Additionally, 32% of respondents who have or are living with a person with a disability went without care
due to distrust or disrespect, compared to 11% of those without a household member with a disability (see
Table 7).
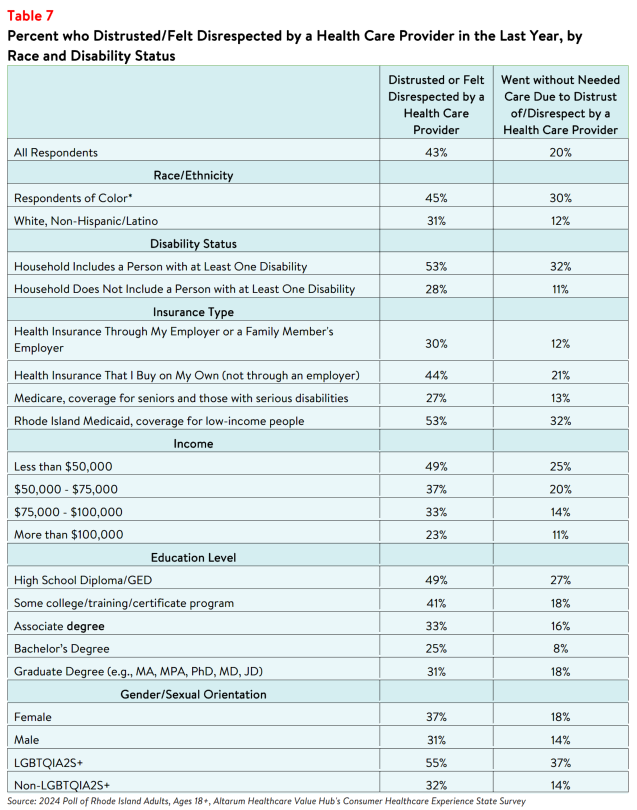
Respondents with Rhode Island Medicaid coverage more frequently reported distrusting or feeling
disrespected by a health care provider compared to those with other insurance types. In addition,
respondents earning less than $50,000 and those with only a high school diploma or GED most
frequently reported distrust/disrespect and going without care due to distrust/disrespect, although
middle- and high-income earners and higher education levels also reported this issue (see Table 7).
Individual & Systemic Racism
Respondents perceived that both individual and systemic racism exist in the U.S. health care system. Sixty percent of respondents believe that people are treated unfairly based on their race or ethnic background either somewhat or very often. When asked what they think causes health care systems to treat people unfairly based on their race or ethnic background:
- 1 in 6 (16%) cited policies and practices built into the health care system;
- 1 in 6 (16%) cited the actions and beliefs of individual health care providers; and
- Over 2 out of 5 (44%) believe it is an equal mixture of both.
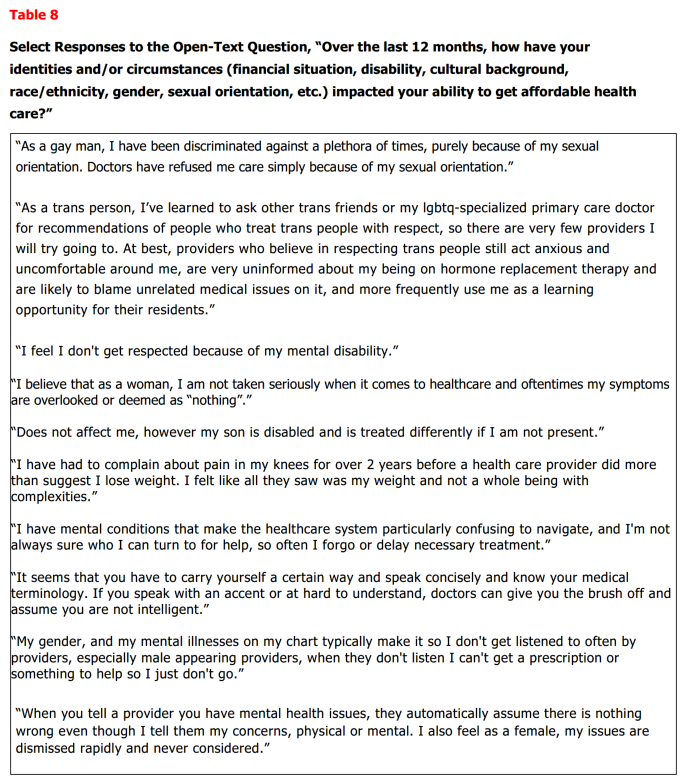
When asked to describe how their identities and/or circumstances have impacted their ability to get
affordable health care, many respondents offered examples of how they perceived their race, income,
insurance status, gender, and ethnicity to impact their health care (see Table 8).
 Dissatisfaction with the Health System and Support for Change
Given this information, it is not surprising that 75% of Rhode Island respondents agree or strongly agree
that the U.S. health care system needs to change. Understanding how the health care system
disproportionately harms some groups of people over others is key to creating a fairer and higher value
system for all.
Making health care affordable for all residents is an area ripe for policymaker intervention, with
widespread support for government-led solutions across party lines. For more information on the types of
strategies Rhode Island residents want their policymakers to pursue, see: Rhode Island Residents Struggle to Afford High Health Care Costs; Worry about Affording Health Care in the Future; Support Government Action across Party Lines, Healthcare Value Hub, Data Brief (May 2024).
Notes
- Fadeyi-Jones, Tomi, et al., High Prescription Drug Prices Perpetuate Systemic Racism. We Can Change It, Patients for Affordable Drugs Now (December 2020), https://patientsforaffordabledrugsnow.org/2020/12/14/drug-pricing-systemic-racism/
- Kaplan, Alan and O’Neill, Daniel, “Hospital Price Discrimination Is Deepening Racial Health Inequity,” New England Journal of Medicine—Catalyst (December 2020), https://catalyst.nejm.org/doi/full/10.1056/CAT.20.0593
- A small share of respondents also reported barriers to care that were unique to their ethnic or cultural backgrounds. Two percent reported not getting needed medical care because they couldn’t find a doctor of the same race, ethnicity or cultural background as them and three percent because they couldn’t find a doctor who spoke their language.
- NCES, “Annual Earnings by Educational Attainments”, National Center for Education Statistics. COE
- Annual Earnings by Educational Attainment - Miles, Angel L., Challenges and Opportunities in Quality Affordable Healthcare Coverage for People with Disabilities, Protect Our Care Illinois (February 2021), https://protectourcareil.org/index.php/2021/02/26/challenges-and-opportunities-in-quality-affordable-health-care-coverage-for-people-with-disabilities/
- A 2019 Commonwealth Fund report noted that people with disabilities risk losing their benefits if they make more than $1,000 per month. According to the Center for American Progress, in most states, people who receive Supplemental Security are automatically eligible for Medicaid. Therefore, if they lose their disability benefits they may also lose their Medicaid coverage. Forbes has also reported on marriage penalties for people with disabilities, including fears about losing health insurance. See: Seervai, Shanoor, Shah, Arnav, and Shah, Tanya, “The Challenges of Living with a Disability in America, and How Serious Illness Can Add to Them,” Commonwealth Fund (April 2019), https://www.commonwealthfund.org/publications/fund-reports/2019/apr/challenges-living-disability-america-and-how-serious-illness-can; Fremstaf, Shawn and Valles, Rebecca, “The Facts on Social Security Disability Insurance and Supplemental Security Income for Workers with Disabilities,” Center for American Progress (May 2013), https://www.americanprogress.org/article/the-facts-on-social-security-disability-insurance-and-supplemental-security-income-for-workers-with-disabilities/; and Pulrang, Andrew, “A Simple Fix For One Of Disabled People’s Most Persistent, Pointless Injustices,” Forbes (April 2020), https://www.forbes.com/sites/andrewpulrang/2020/08/31/a-simple-fix-for-one-of-disabled-peoples-most-persistent-pointless-injustices/?sh=6e159b946b71
Methodology
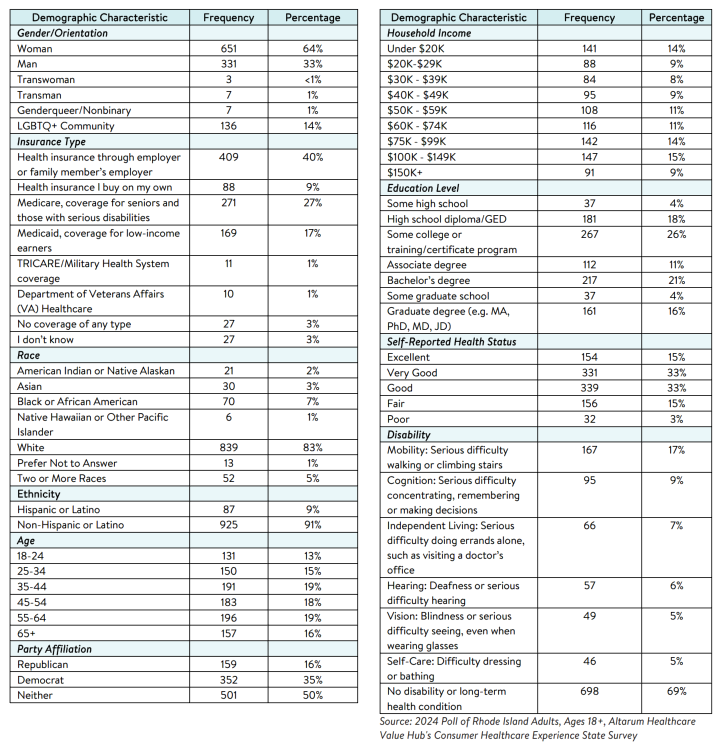
Altarum’s Consumer Healthcare Experience State Survey (CHESS) is designed to elicit respondents’ views on a wide range of health system issues, including confidence using the health system, financial burden and possible policy solutions. This survey, conducted from February 19 to March 27, 2024, used a web panel from Dynata with a demographically balanced sample of approximately 1,100 respondents who live in Rhode Island. Information about Dynata’s recruitment and compensation methods can be found here. The survey was conducted in English or Spanish and restricted to adults ages 18 and older. Respondents who finished the survey in less than half the median time were excluded from the final sample, leaving 1,012 cases for analysis. After those exclusions, the demographic composition of respondents was as follows, although not all demographic information has complete response rates:

HEALTHCARE VALUE HUB
The Healthcare Value Hub can help you find free, timely information about policies and practices to achieve health systems that are equitable, affordable, and focused on the goals and needs of the people the system is meant to serve.
Share
![]()
![]()
![]()

Follow
![]()
![]()


![]()