Rhode Island Survey Respondents Have Difficulty Navigating the Health Care System, Understanding Cost- Sharing Obligations; Express Bipartisan Support for Government Action
A 2024 survey of more than 1,000 Rhode Island adults, conducted from February 19 to March 27, 2024,
found that many respondents face challenges confidently navigating the health care system and
understanding their cost-sharing obligations. These challenges are sometimes attributed to low levels
of health insurance literacy.1 Inadequate health literacy2 (a closely related concept) has been associated
with poorer health outcomes, lower patient satisfaction, and higher costs.3 This brief surfaces respondents’ experiences operating within the health care system, along with support for related policy
solutions.
Confidence in Obtaining Care, Navigating Costs, & Resolving Issues
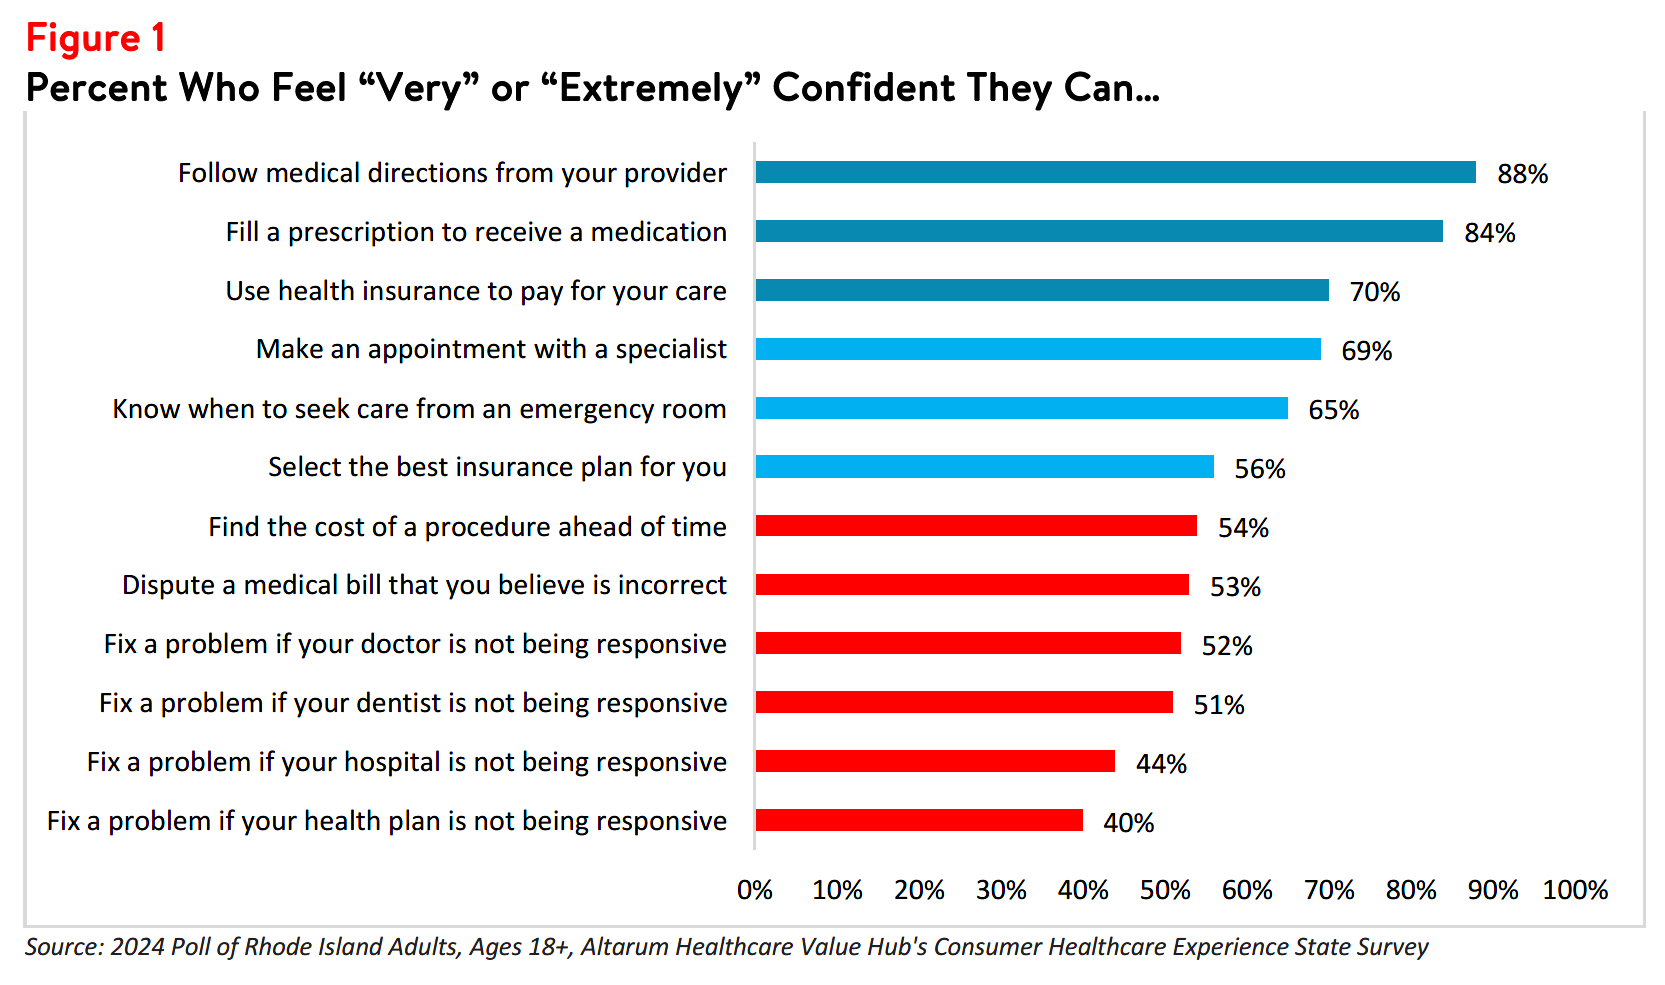
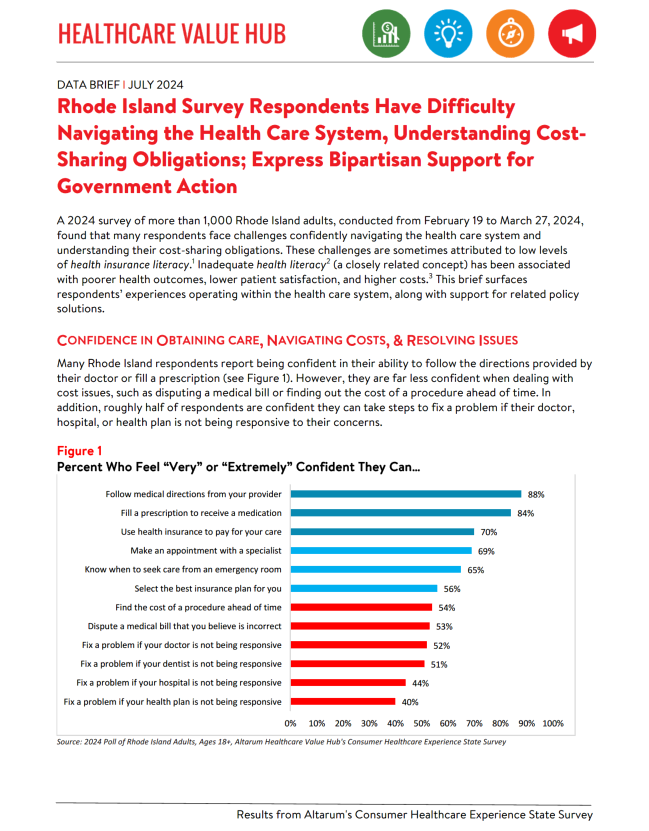
Many Rhode Island respondents report being confident in their ability to follow the directions provided by
their doctor or fill a prescription (see Figure 1). However, they are far less confident when dealing with
cost issues, such as disputing a medical bill or finding out the cost of a procedure ahead of time. In
addition, roughly half of respondents are confident they can take steps to fix a problem if their doctor,
hospital, or health plan is not being responsive to their concerns.
Success in Finding Health Care Price and Quality Information
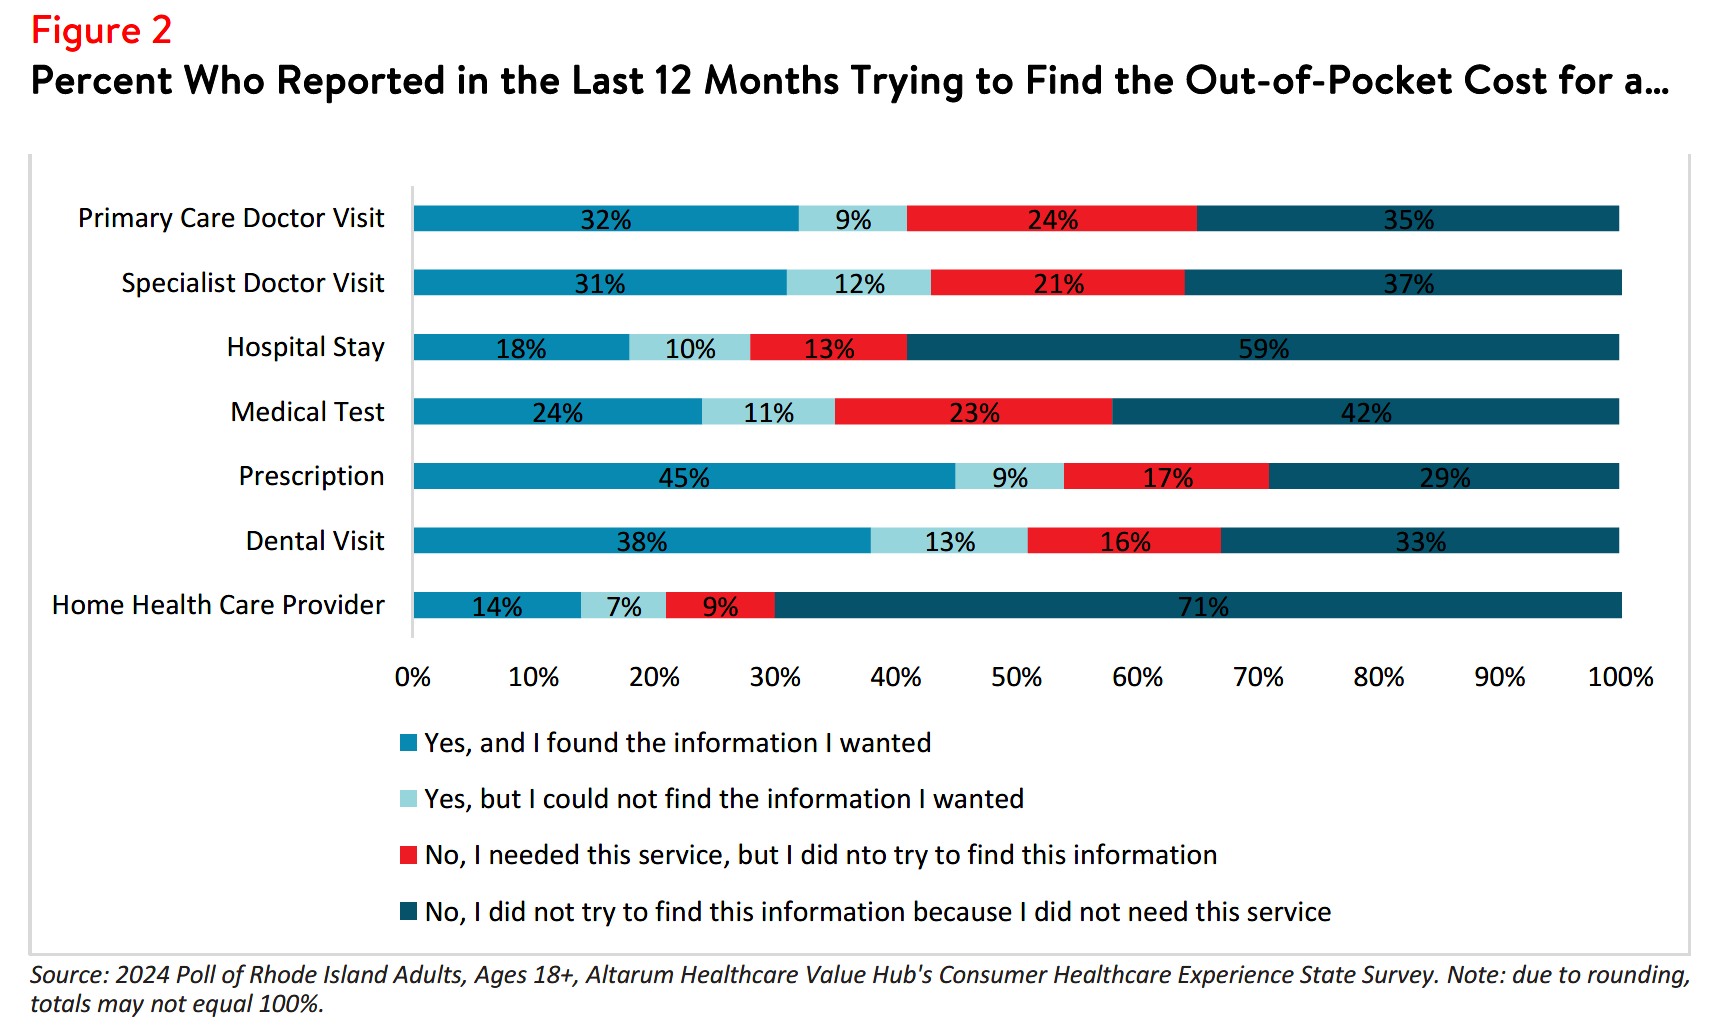
Forty-six percent (46%) of respondents were not confident that they could find the cost of a procedure
ahead of time. While many respondents who searched for price and quality information successfully found
the information that they were looking for, there were still respondents who either could not find the cost
information they were looking for or did not look for cost information ahead of time even though they
needed a service (see Figure 2).
The most frequent reasons respondents reported not seeking out price or quality information were:
- 36%—Followed a doctors’ recommendations or referrals
- 27%—The act of looking for information felt confusing or overwhelming
- 22%—Did not know where to look
Notably, few of these respondents reported that out-of-pocket cost or quality were unimportant to them
(7% and 5%, respectively). These reasons could also be influenced by this information not being accessible, despite federal price transparency mandates for hospitals.4
Respondents who attempted to find hospital cost or quality information but were unsuccessful reported
facing a variety of barriers. Many respondents who were unsuccessful in their search for cost information
reported that the available resources showing cost information were confusing (35%), their insurance plan
or their provider/doctor/hospital would not give them a price estimate (26% and 35%, respectively), and
that price information was insufficient (20%). In unsuccessful searches for hospital quality information,
respondents reported that resources available to search for quality information were confusing (28%) and
that the quality information available was not sufficient (20%).
Lack of knowledge of hospital quality and potential costs may impede consumers’ ability to plan for
needed care and budget for the expense of a hospital stay, which can be costly,5 particularly for those who are un- or under-insured.
Difficulty Understanding Common Health Care Terms
Consistently understanding common health care system terms and cost-sharing obligations remains
challenging for many Rhode Island respondents.
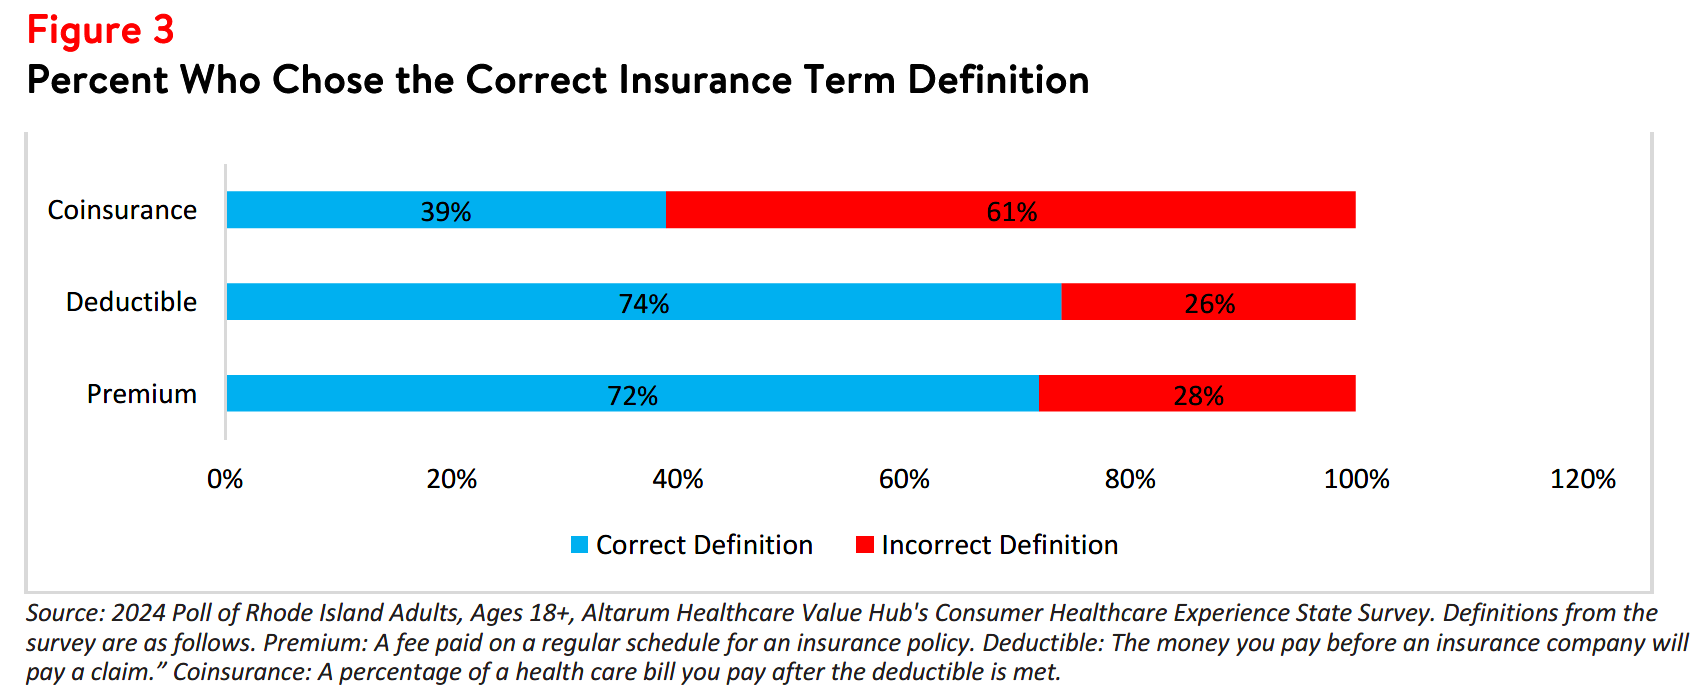
When given multiple choices, respondents were able to choose the correct definitions for premium and
deductible nearly three-fourths of the time, but less than half were able to accurately define coinsurance
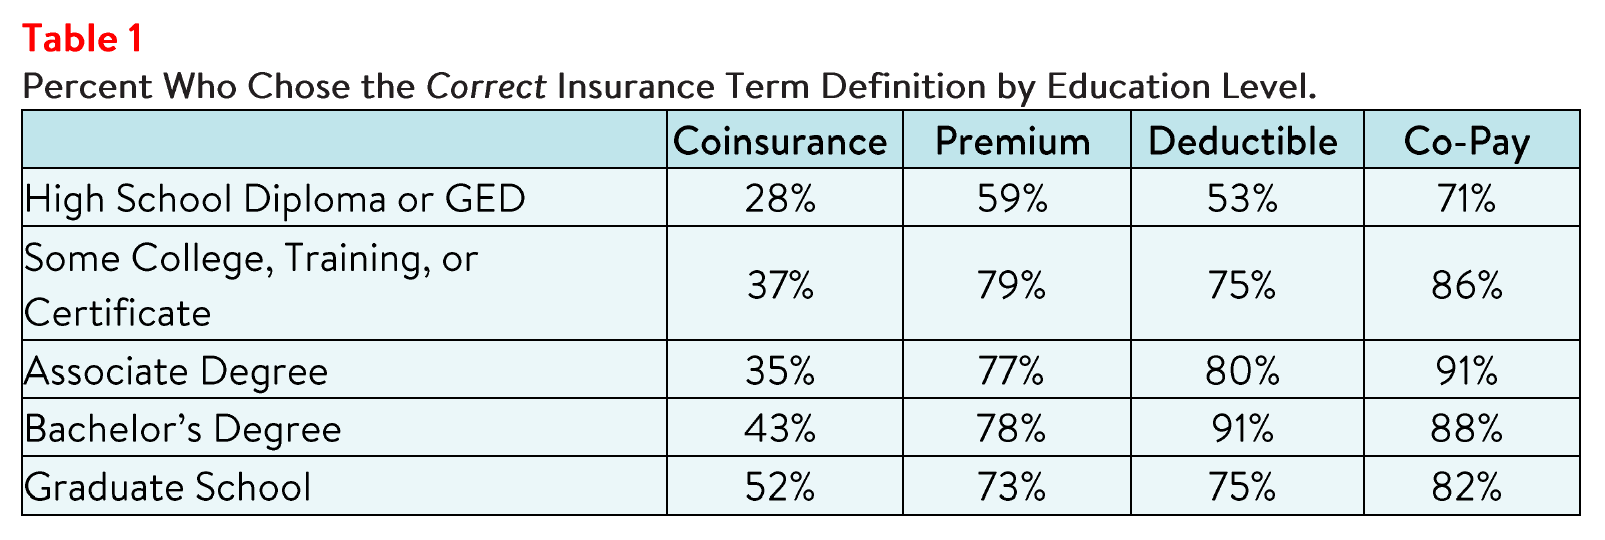
(see Figure 3). When examining education levels and correct answers, respondents with higher levels of
education correctly selected the definition of these terms at a higher rate than respondent who had lower
levels of education. However, the correct definition of coinsurance was tough for all respondents
regardless of education level. Respondents holding a high school education/GED certification correctly
defining coinsurance more than a quarter (28%) of the time, while respondents holding a graduate degree
selected the correct definition of coinsurance about half (52%) of the time (see Table 1). This aligns with a
national study that found half of insured adults say they find at least one aspect of how their insurance
works—such as what it covers, what their out-of-pocket costs will be, and common terminology—at least
somewhat difficult to understand.6 Ultimately, difficulty understanding cost-sharing terms and other
components of the system may make it harder for consumers to navigate the health care system, get
needed care, and anticipate the out-of-pocket costs they will be expected to pay. Efforts to improve
health insurance literacy may address this consumer hindrance.
Relationship Between Quality and Price
Studies show there is little relationship between the quality and the price of a medical service.7 However, nearly 2 out of 5 respondents (39%) reported that they would be willing to pay more to see a doctor with higher quality ratings.
Both cost and quality are important to Rhode Island’s health care consumers. Over half (54%) of Rhode
Island respondents indicated that, if two doctors or health care providers had equal quality ratings, out-of-
pocket costs would be a very or extremely important factor in deciding between the two professionals.
Conversely, 61% of respondents indicated that, if two providers’ out-of-pocket costs were equal, quality
ratings would be a very or extremely important factor in deciding between the two professionals.
Unexpected Medical Bills
Twenty-six percent of Rhode Island respondents reported receiving an unexpected medical expense in the prior 12 months. The rate was highest among respondents with health insurance they purchase on their own or through their employer (30%), compared to those with Medicare (25%), or Rhode Island Medicaid (17%).
These unexpected bills take different forms. Of the respondents reporting that they received an
unexpected bill:
- 44%—reported the amount charged was higher than expected; and
- 35%—reported a bill from a doctor they didn’t expect.
Smaller numbers reported being charged out-of-network rates when they thought the doctor was in-
network (17%), being charged for services they did not receive (9%), or experiencing something else
unexpected (17%).
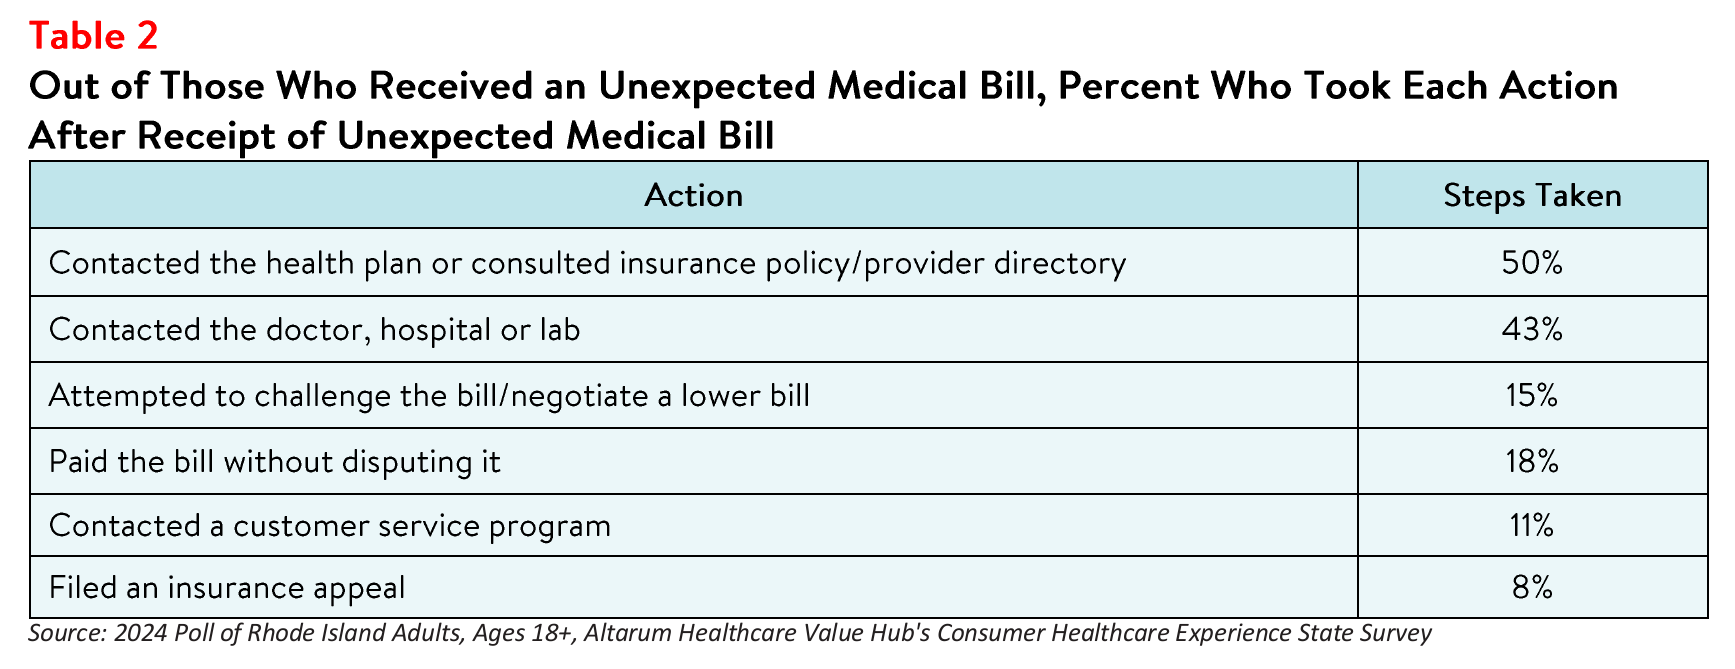
Among those who received unexpected medical bills in the past 12 months, 18% reported paying the bill
without disputing it. Many reported taking steps like contacting their health plan (50%) or contacting their
doctor, hospital, or lab (43%), but very few took other possible steps to resolve the bill (see Table 2).
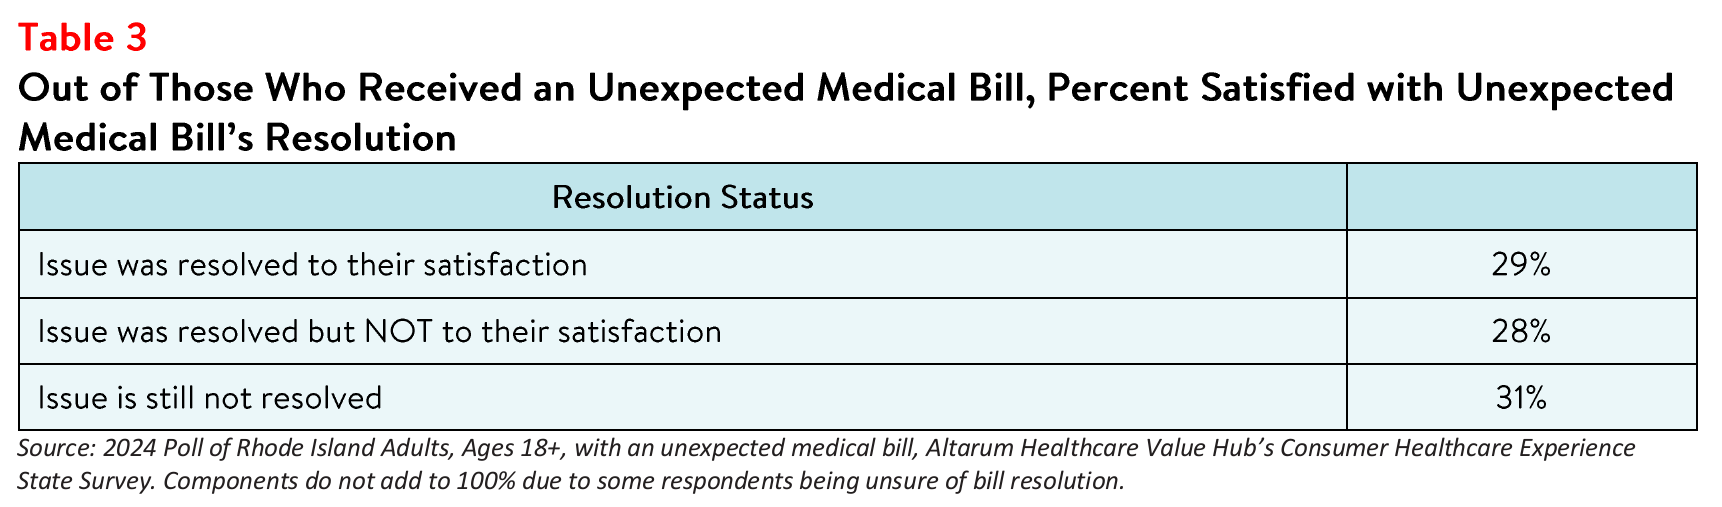
Ultimately, 28% report being dissatisfied with the resolution of their unexpected bill.
Forty four percent (44%) of Rhode Island respondents with an unexpected medical bill took more than
one step to resolve the unexpected bill. However, very few reported using any of the following strategies
to resolve their bill:
- Contacting an insurance broker
- Filing an insurance appeal
- Contacting state legislators or member of Congress
- Contacting a lawyer
- Filing a formal complaint
Among Rhode Island respondents who had an unexpected medical bill, just 29% indicated that the issue
was resolved to their satisfaction (see Table 3).
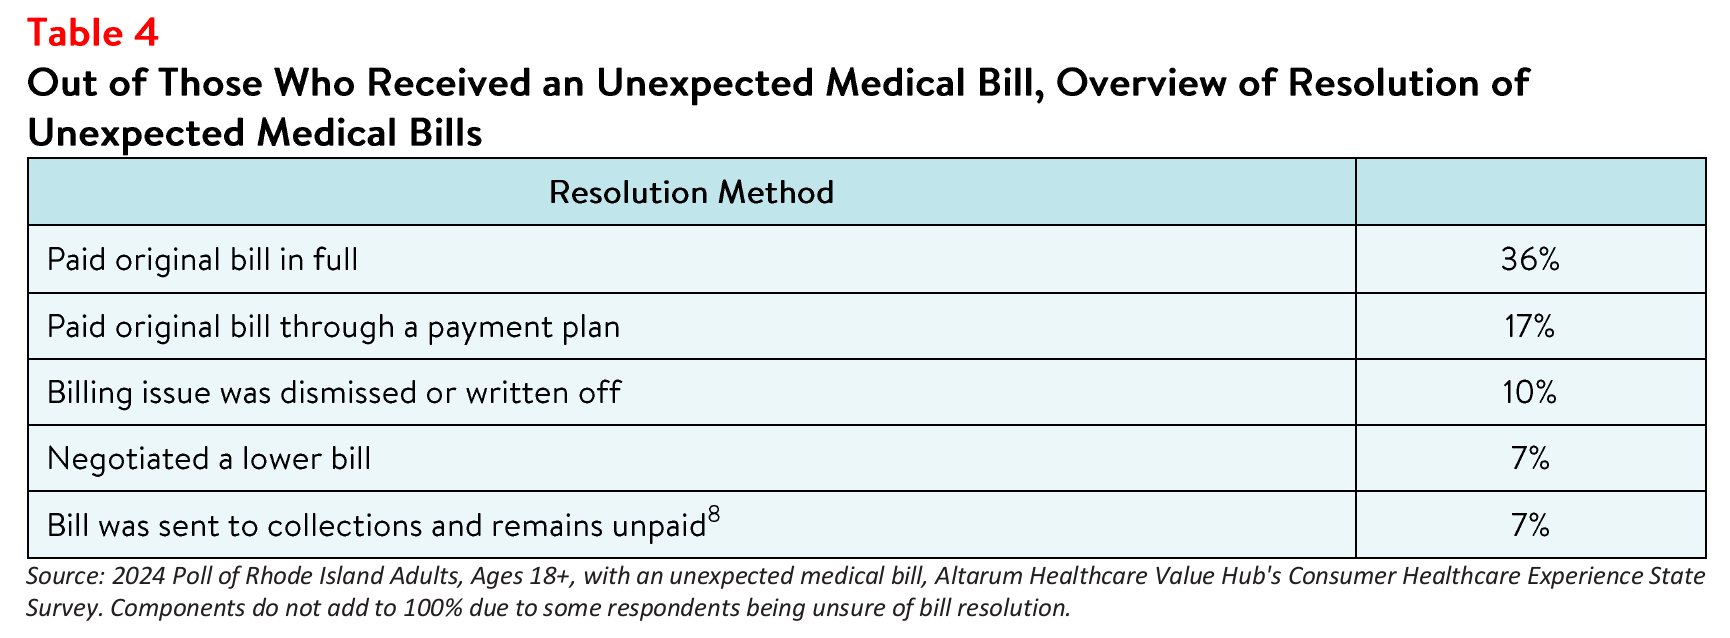
For those whose bill was resolved by the time of the survey, most paid the bill in full or through a payment
plan. A minority got relief from the bill, either by negotiating a lower bill or having the bill dismissed (see
Table 4). Seven percent had their bill sent to collections.
High numbers of both satisfied and dissatisfied respondents report attempting to contact their health
plan, doctor, hospital, or lab to resolve the unexpected bill. However, consumers satisfied with how their
medical bill was resolved reported having tried other strategies, such as filing an appeal. In contrast,
consumers who reported being dissatisfied with how their medical bill was resolved more often reported
paying their bill without disputing it. Perhaps not surprisingly, those that felt satisfied with how their
medical bill was resolved were more likely to have either negotiated a lower payment or had their bill
written off or dismissed.
Support for Solutions Across Party Lines
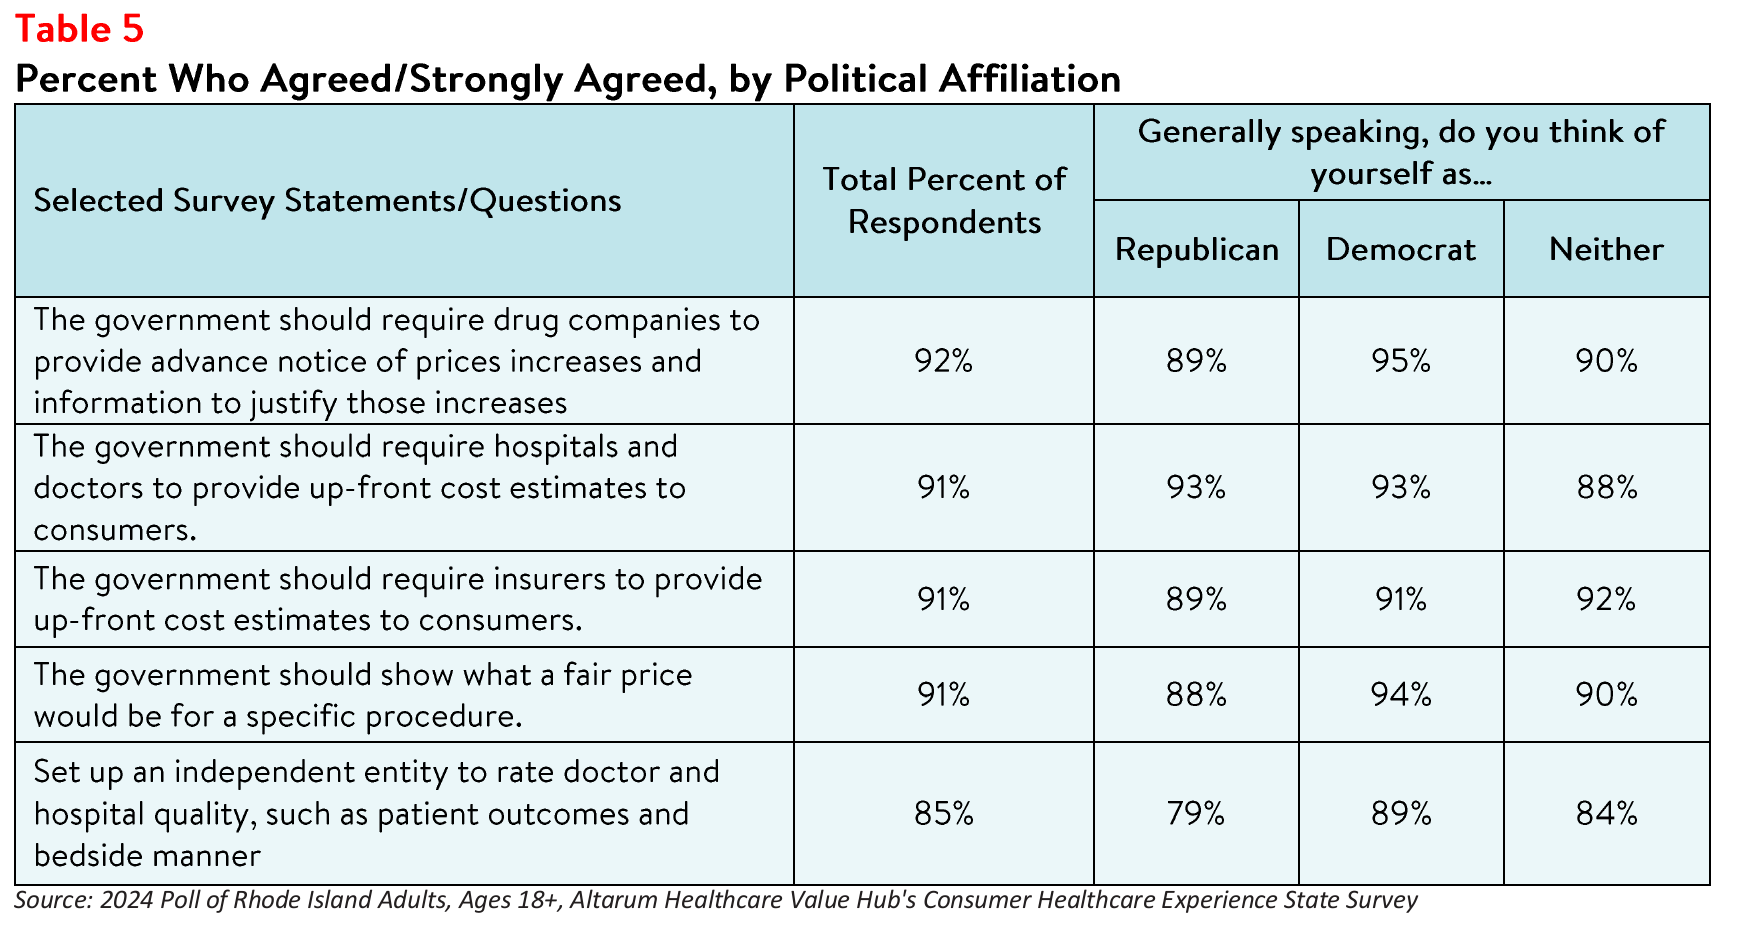
When it comes to tackling problems in the health care system, respondents endorsed a number of
transparency-oriented strategies, including:
- 92%—Require drug companies to provide advanced notice of price increases and information to justify those increases
- 91%—Require hospitals and doctors to provide up-front cost estimates to consumers
- 91%—Require insurers to provide up-front cost estimates to consumers
- 91%—Show what a fair price would be for specific procedures
- 85%—Set up an independent entity to rate doctor and hospital quality, such as patient outcomes and bedside manner
Moreover, respondents endorsed these approaches across party lines (see Table 5).
Discussion
While Rhode Island respondents report confidence in their ability to follow directions from their doctor or
fill a prescription, they are less confident when dealing with cost issues and resolving problems with
providers, health plans, and hospitals. Furthermore, consumers’ poor understanding of some common
terms may make it difficult to anticipate out-of-pockets costs and budget for health care expenses. These
difficulties may contribute to the receipt of unexpected medical bills, amplify affordability burdens, and
impede their ability to resolve the resulting bills to their satisfaction.
Price transparency tools can aid consumers by allowing them to plan for the expense of needed health
care services and may also enable state policymakers to address unwarranted price variation. However,
price transparency alone does not make markets more efficient, and transparency tools are generally not
successful at getting consumers to shop for lower-priced services.9 Instead, a combination of price
transparency tools and evidence-based policies should be used to increase health literacy across the state. Rhode Island survey respondents endorsed a range of policy fixes that elected officials could pursue, both transparency- and non-transparency-related.
Notes
- A person's ability to seek, obtain, and understand health insurance plans, and once enrolled, use their insurance to seek appropriate health care services.
- A person’s ability to obtain, process, and understand basic health information and services needed to manage one’s health and make appropriate health decisions.
- Shahid, R., Shoker, M., Chu, L.M. et al. Impact of low health literacy on patients’ health outcomes: a multicenter cohort study. BMC Health Serv Res 22, 1148 (2022). https://doi.org/10.1186/s12913-022-08527-9
- As of January 1, 2021, the Centers for Medicare and Medicaid Services (CMS) requires hospitals to make public a
machine-readable file containing a list of standard charges for all items and services provided by the hospital, as well as a consumer-friendly display of at least 300 shoppable services that a patient can schedule in advance. However, Compliance from hospitals has been mixed, indicating that the rule has yet to demonstrate the desired effect. https://www.healthaffairs.org/content/forefront/hospital-price-transparency-progress-and-commitment-achieving-its-potential - According to Health Forum, an affiliate of the American Hospital Association, hospital adjusted expenses per inpatient day in Rhode Island were $3,102 in 2022. See: Kaiser Family Foundation, State Health Facts Data: Hospital Adjusted Expenses per Inpatient Day, (Accessed May 29, 2024).
- Pollitz, K., Pestaina, K., Montero, A., Lopes, L., Valdes, I., Kirzinger, A., Brodie, M., KFF Survey of Consumer Experiences with Health Insurance, (KFF, June 15, 2024) https://www.kff.org/report-section/kff-survey-of-consumer-experiences-with-health-insurance-methodology/ (Accessed September 26, 2024).
- "What Do We Know About Prices And Hospital Quality?", Health Affairs Blog, July 29, 2019.
https://www.healthaffairs.org/content/forefront/do-we-know-prices-and-hospital-quality (Accessed September 26,
2024). - Across all types of medical bills – expected and unexpected –involvement of a collection agency was common. Thirteen percent of Rhode Island respondents reported having been contacted by a collection agency over a medical bill in the prior 12 months. See: Rhode Island Respondents Struggle to Afford High Health Care Costs; Express Across Party Lines Support for a Range of Government Solutions, Healthcare Value Hub, June 2024
- Benavidez G, Frakt A. Price Transparency in Health Care Has Been Disappointing, but It Doesn’t Have to
Be. JAMA. 2019;322(13):1243–1244. https://jamanetwork.com/journals/jama/fullarticle/2752049 (Accessed on
September 26, 2024).
Methodology
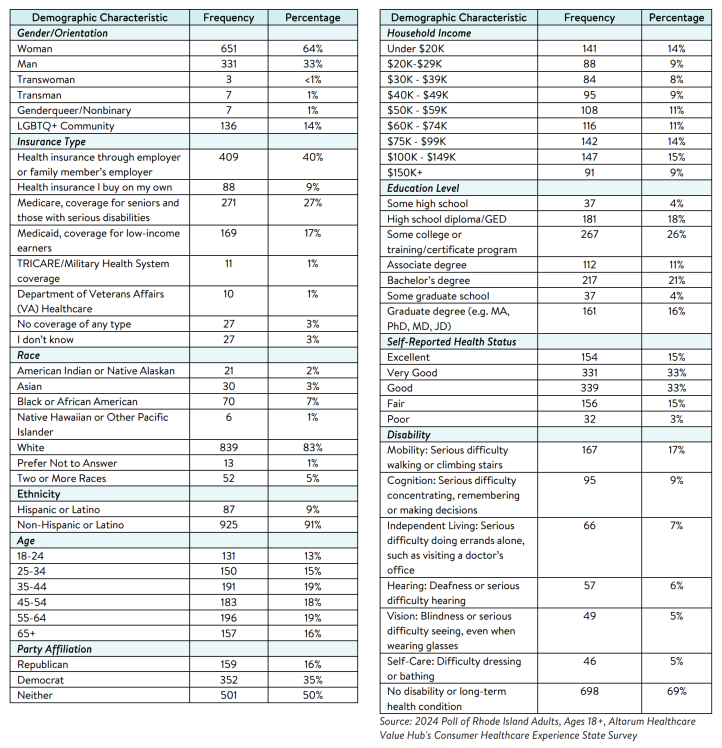
Altarum’s Consumer Healthcare Experience State Survey (CHESS) is designed to elicit respondents’ views on a wide range of health system issues, including confidence using the health system, financial burden and possible policy solutions. This survey, conducted from February 19 to March 27, 2024, used a web panel from Dynata with a demographically balanced sample of approximately 1,100 respondents who live in Rhode Island. Information about Dynata’s recruitment and compensation methods can be found here. The survey was conducted in English or Spanish and restricted to adults ages 18 and older. Respondents who finished the survey in less than half the median time were excluded from the final sample, leaving 1,012 cases for analysis. After those exclusions, the demographic composition of respondents was as follows, although not all demographic information has complete response rates:

HEALTHCARE VALUE HUB
The Healthcare Value Hub can help you find free, timely information about policies and practices to achieve health systems that are equitable, affordable, and focused on the goals and needs of the people the system is meant to serve.
Share
![]()
![]()
![]()

Follow
![]()
![]()


![]()