Rhode Island Survey Respondents Worried about High Drug Costs; Support a Range of Government Solutions
According to a survey of more than 1,000 Rhode Island adults, conducted from February 10 to March 27,
2024, respondents are concerned about prescription drug costs and express a strong desire for
policymakers to enact solutions.
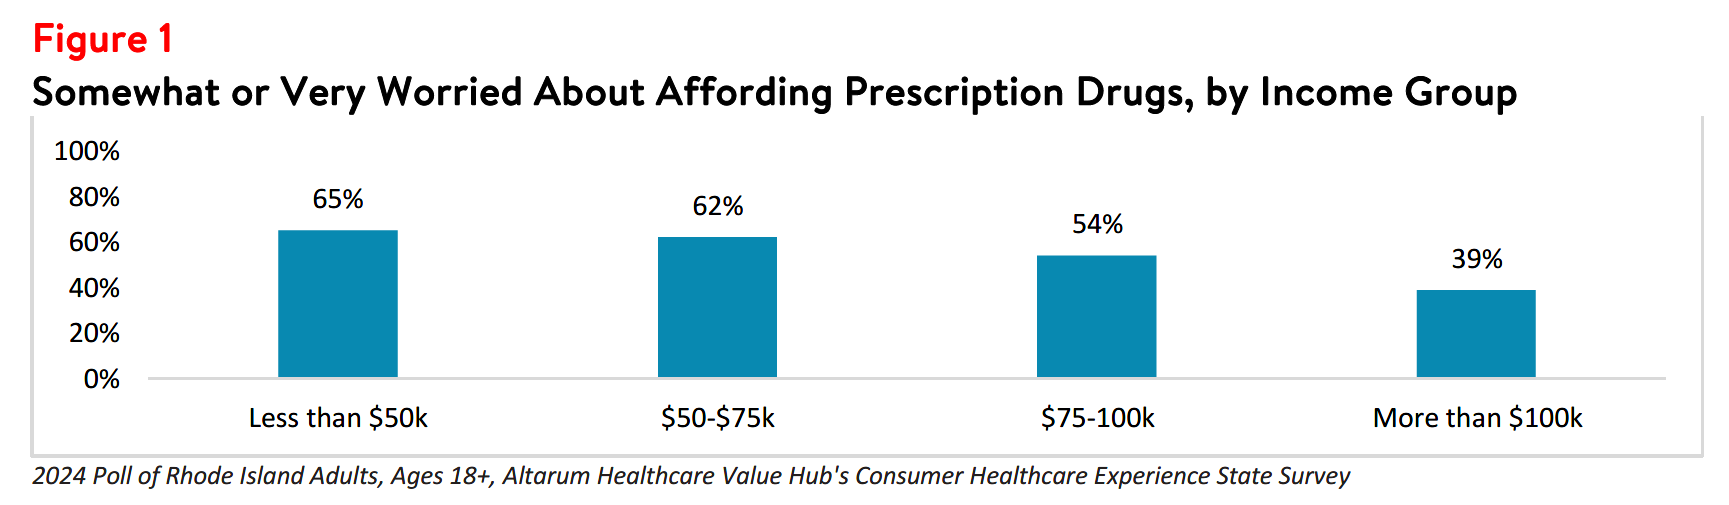
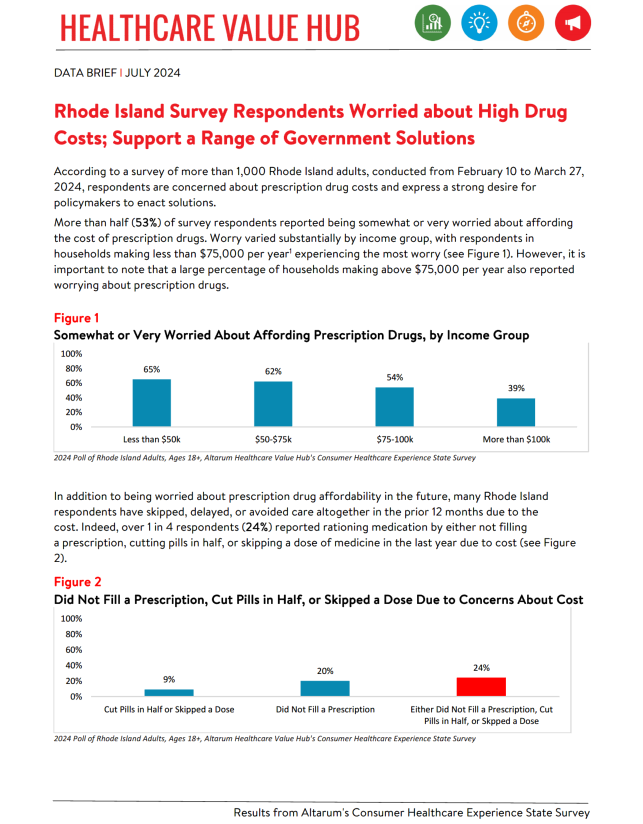
More than half (53%) of survey respondents reported being somewhat or very worried about affording
the cost of prescription drugs. Worry varied substantially by income group, with respondents in
households making less than $75,000 per year1 experiencing the most worry (see Figure 1). However, it is important to note that a large percentage of households making above $75,000 per year also reported
worrying about prescription drugs.
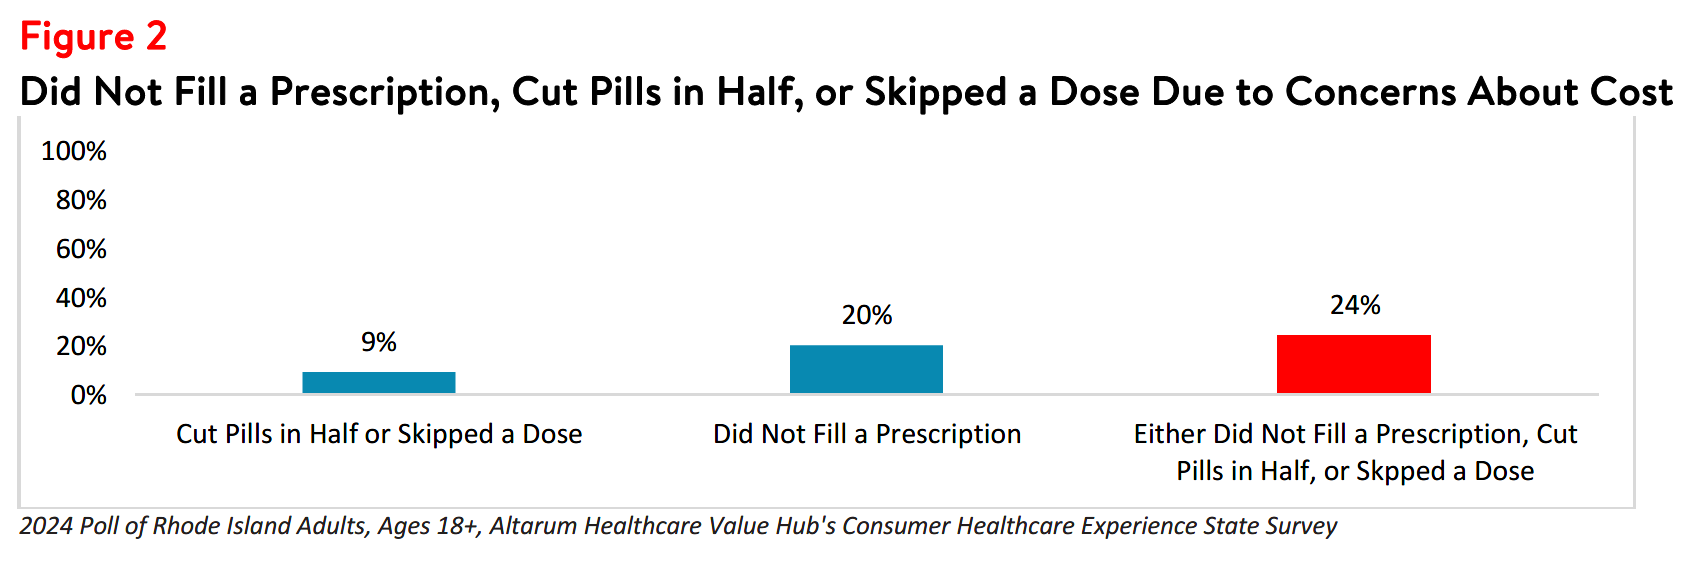
In addition to being worried about prescription drug affordability in the future, many Rhode Island
respondents have skipped, delayed, or avoided care altogether in the prior 12 months due to the
cost. Indeed, over 1 in 4 respondents (24%) reported rationing medication by either not filling
a prescription, cutting pills in half, or skipping a dose of medicine in the last year due to cost (see Figure
2).
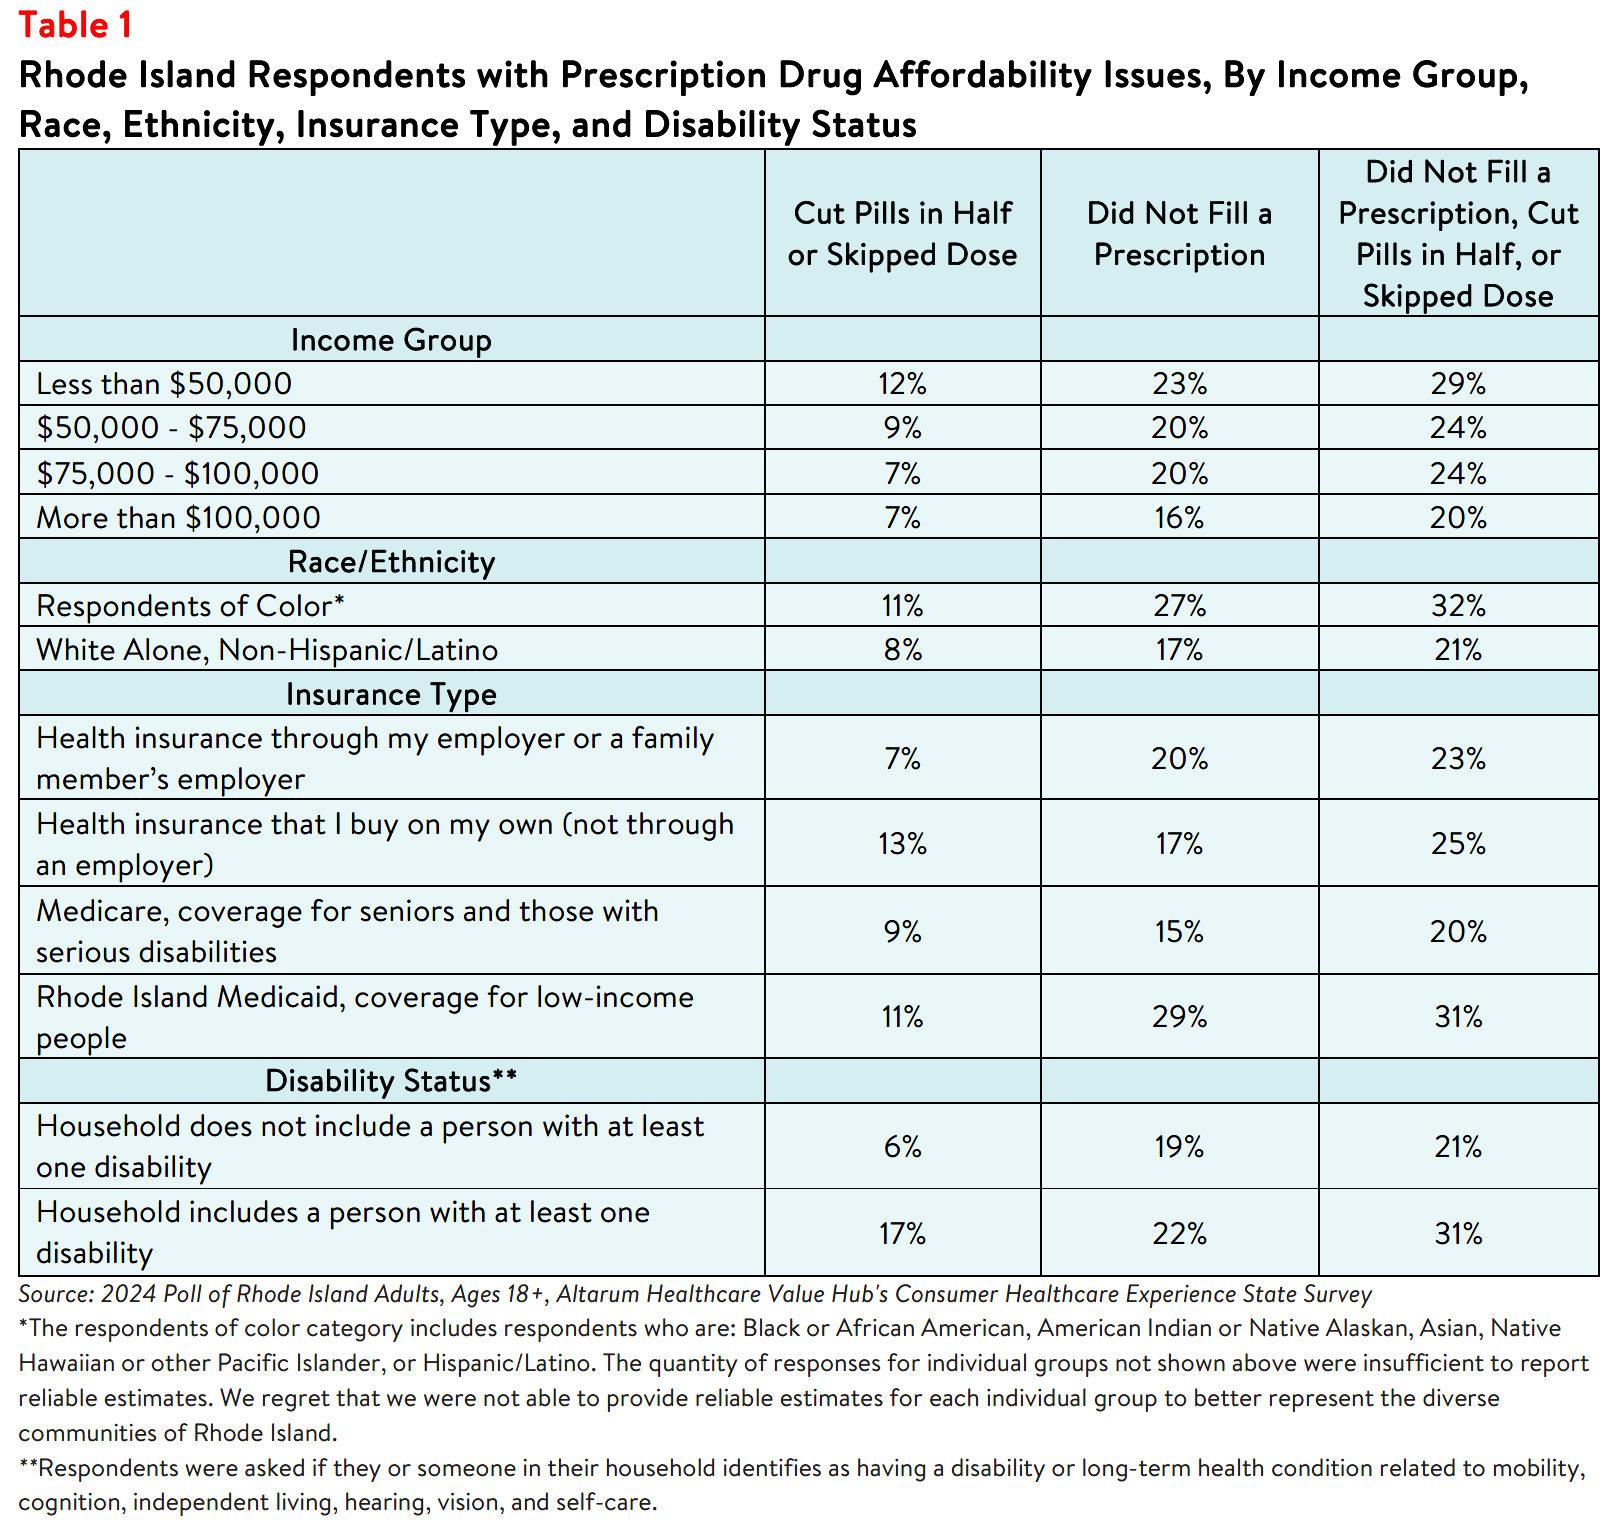
These hardships impact people in lower-income households. As Table 1 shows, respondents living in
households earning less than $100,000 per year reported higher rates of rationing their prescription
medicines than respondents living in higher-income households. However, these hardships are alarmingly
prevalent in households earning more than $100,000 per year as well.
Respondents with Rhode Island Medicaid coverage reported the highest rates of rationing medication
compared to other insurance types, followed by those with private insurance. Finally, respondents living in
households with a person with a disability reported notably higher rates of rationing medication due to
cost in the past 12 months compared to respondents without a disabled household member (see Table 1).
Considering these prescription drug cost concerns—as well as concerns about high healthcare costs
generally2—it is not surprising that Rhode Island respondents were generally dissatisfied with the health
system:
- Just 26% agreed or strongly agreed that “we have a great healthcare system in the U.S.,”
- While 75% agreed or strongly agreed that “the system needs to change.”
When given 15 options, the options cited most frequently as being a "major reason" for high health care
costs were:
- 79%—Drug companies charging too much money
- 72%—Hospitals charging too much money
- 74%—Insurance companies charging too much money
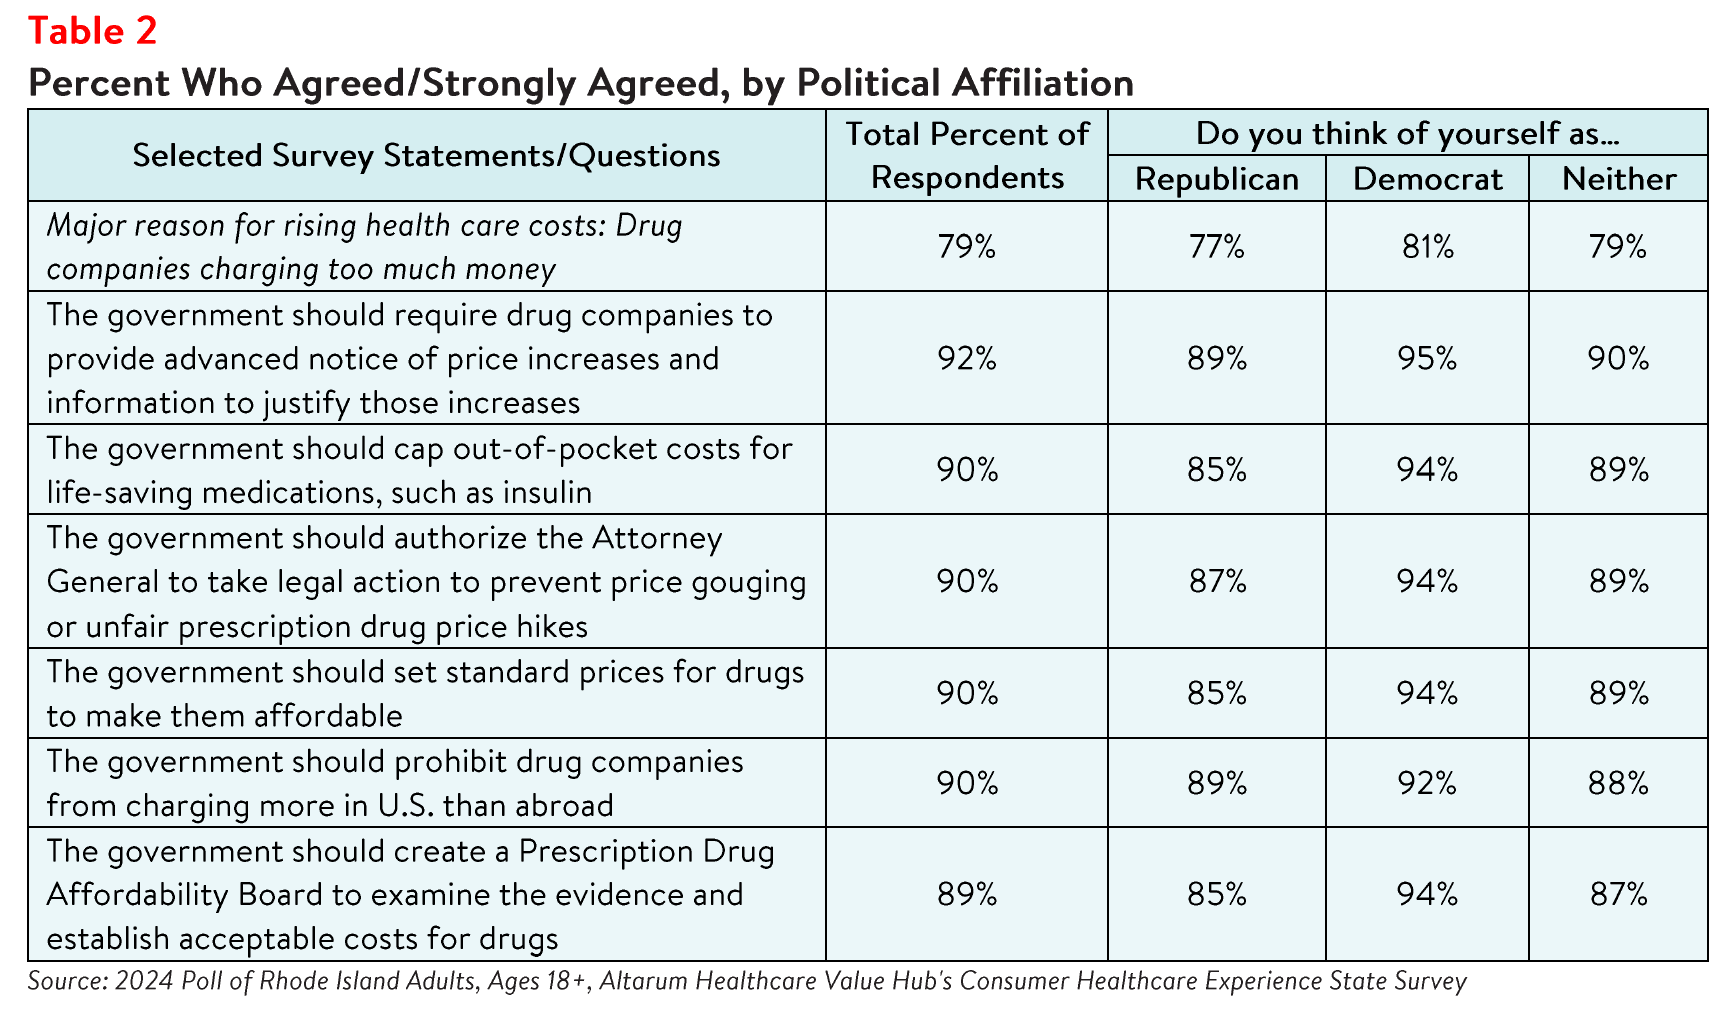
When it comes to tackling high drug costs, Rhode Island respondents endorsed a number of prescription
drug-related strategies:
- 92%—Require drug companies to provide advanced notice of price increases and information to justify those increases
- 90%—Cap out-of-pocket costs for life-saving medications, such as insulin
- 90%—Authorize the Attorney General to take legal action to prevent price gouging or unfair prescription drug price hikes
- 90%—Set standard prices for drugs to make them affordable
- 90%—Prohibit drug companies from charging more in the U.S. than abroad
- 89%—Create a Prescription Drug Affordability Board to examine the evidence and establish acceptable costs for drugs
Moreover, there is substantial support for government action on drug costs regardless of the
respondent’s political affiliation (see Table 2).
While Rhode Island respondents are united in calling for the government to address high drug costs, they
also see a role for themselves:
- 74% would switch from a brand name to an equivalent generic drug if given a chance
- 54% have found, or have tried to find, out the cost of a drug beforehand
Conclusion
The high burden of health care and prescription drug affordability, along with high levels of support for
change, suggests that elected leaders and other stakeholders need to make addressing this consumer
burden a top priority. Moreover, the COVID crisis has led state residents to take a hard look at how well
health and public health systems are working for them, with strong support for a wide variety of actions.
Annual surveys can help assess whether progress is being made.
Notes
-
Median household income in Rhode Island was $81,370 (2018-2022). U.S. Census, Quick Facts. Retrieved from: U.S. Census Bureau QuickFacts: Rhode Island
-
For more detailed information about health care affordability burdens facing Rhode Island respondents, please see Healthcare Value Hub, Rhode Island Residents Struggle to Afford High Health Care Costs; Worry About Affording Health Care in the Future; Support Government Action across Party Lines, Data Brief (May 2024).
Methodology
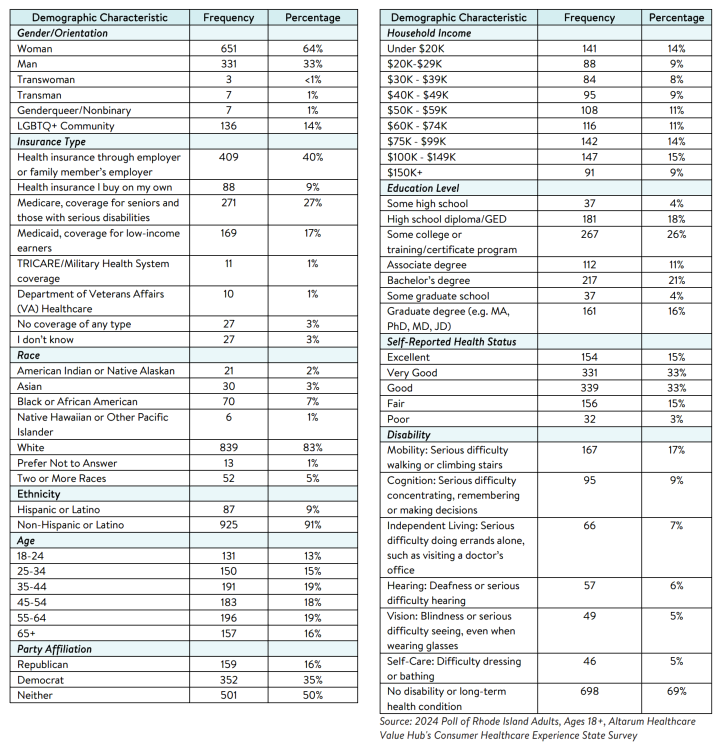
Altarum’s Consumer Healthcare Experience State Survey (CHESS) is designed to elicit respondents’ views on a wide range of health system issues, including confidence using the health system, financial burden and possible policy solutions. This survey, conducted from February 19 to March 27, 2024, used a web panel from Dynata with a demographically balanced sample of approximately 1,100 respondents who live in Rhode Island. Information about Dynata’s recruitment and compensation methods can be found here. The survey was conducted in English or Spanish and restricted to adults ages 18 and older. Respondents who finished the survey in less than half the median time were excluded from the final sample, leaving 1,012 cases for analysis. After those exclusions, the demographic composition of respondents was as follows, although not all demographic information has complete response rates:

HEALTHCARE VALUE HUB
The Healthcare Value Hub can help you find free, timely information about policies and practices to achieve health systems that are equitable, affordable, and focused on the goals and needs of the people the system is meant to serve.
Share
![]()
![]()
![]()

Follow
![]()
![]()


![]()