Rhode Island Survey Respondents Worry about High Hospital Costs; Have Difficulty Estimating Quality/Cost of Care; and Express Bipartisan Support for Government Action
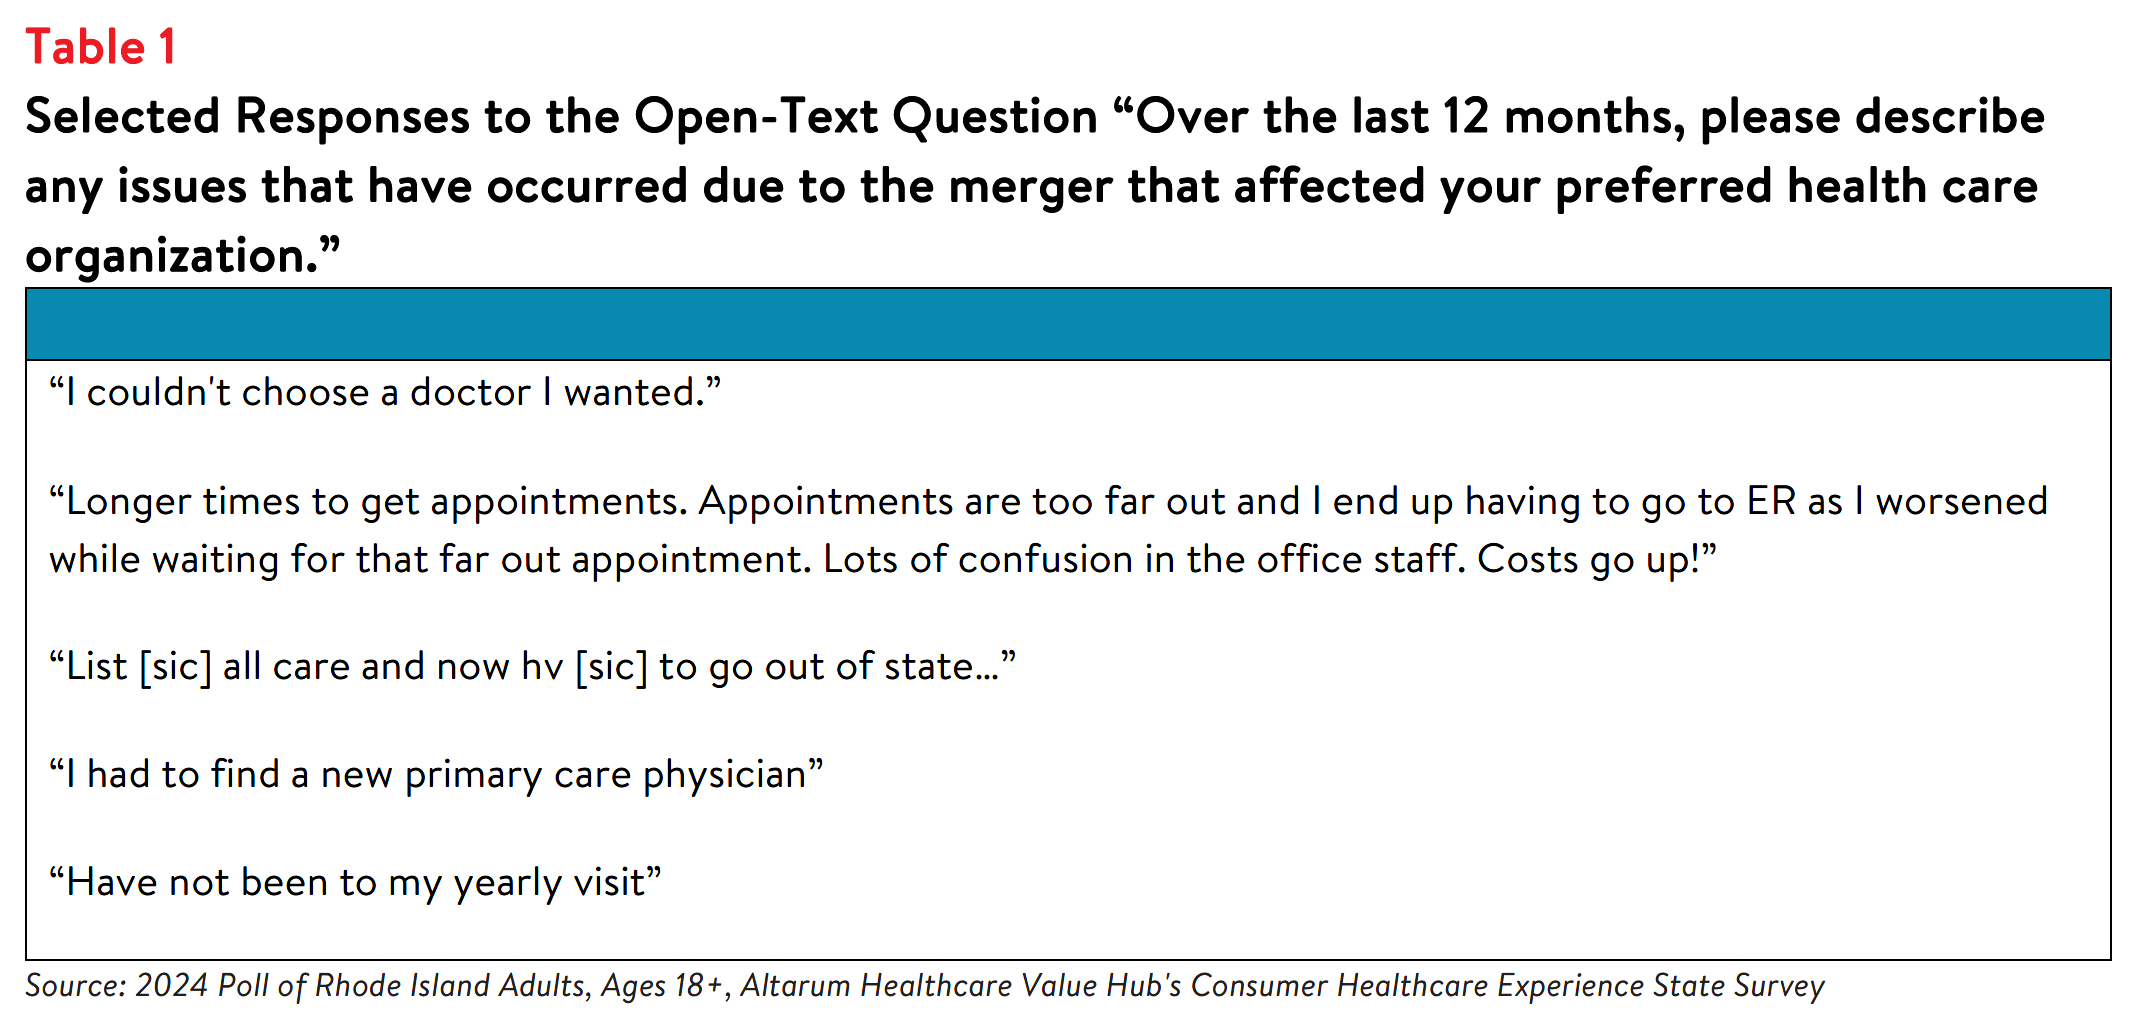
Hospitals provide essential services and are vital to the well-being of our communities. However, a survey
of more than 1,000 Rhode Island adults, conducted from February 19 to March 27, 2024, finds that many
Rhode Island residents worry about hospital costs and support a variety of government-led solutions
across party lines.
Hardship and Worry About Hospital Costs
A substantial portion of Rhode Island respondents worry about affording health care costs both now and
in the future, and many reported experiencing financial hardship resulting from medical bills. Over three
in five (60% of) respondents reported being “worried” or “very worried” about affording medical costs
from a serious illness or accident. Rhode Island respondents may have cause to worry about affording
hospital care—of the 26% of respondents who reported receiving an unexpected medical bill in the past
year, 44% say that at least one such bill came from a hospital.
Skills Navigating Hospital Care
Rhode Island respondents reported fairly high confidence in their ability to know when to seek emergency
care, with 65% reporting that they are very or extremely confident about knowing when to go to the
emergency department versus an urgent care center or a primary care provider. However, they are
slightly less confident in their ability to find hospital costs and quality information. Forty-six percent of
respondents are NOT confident they can find out the cost of a procedure ahead of time, and many are
NOT confident they can find quality ratings for doctors (49%) or hospitals (50%).
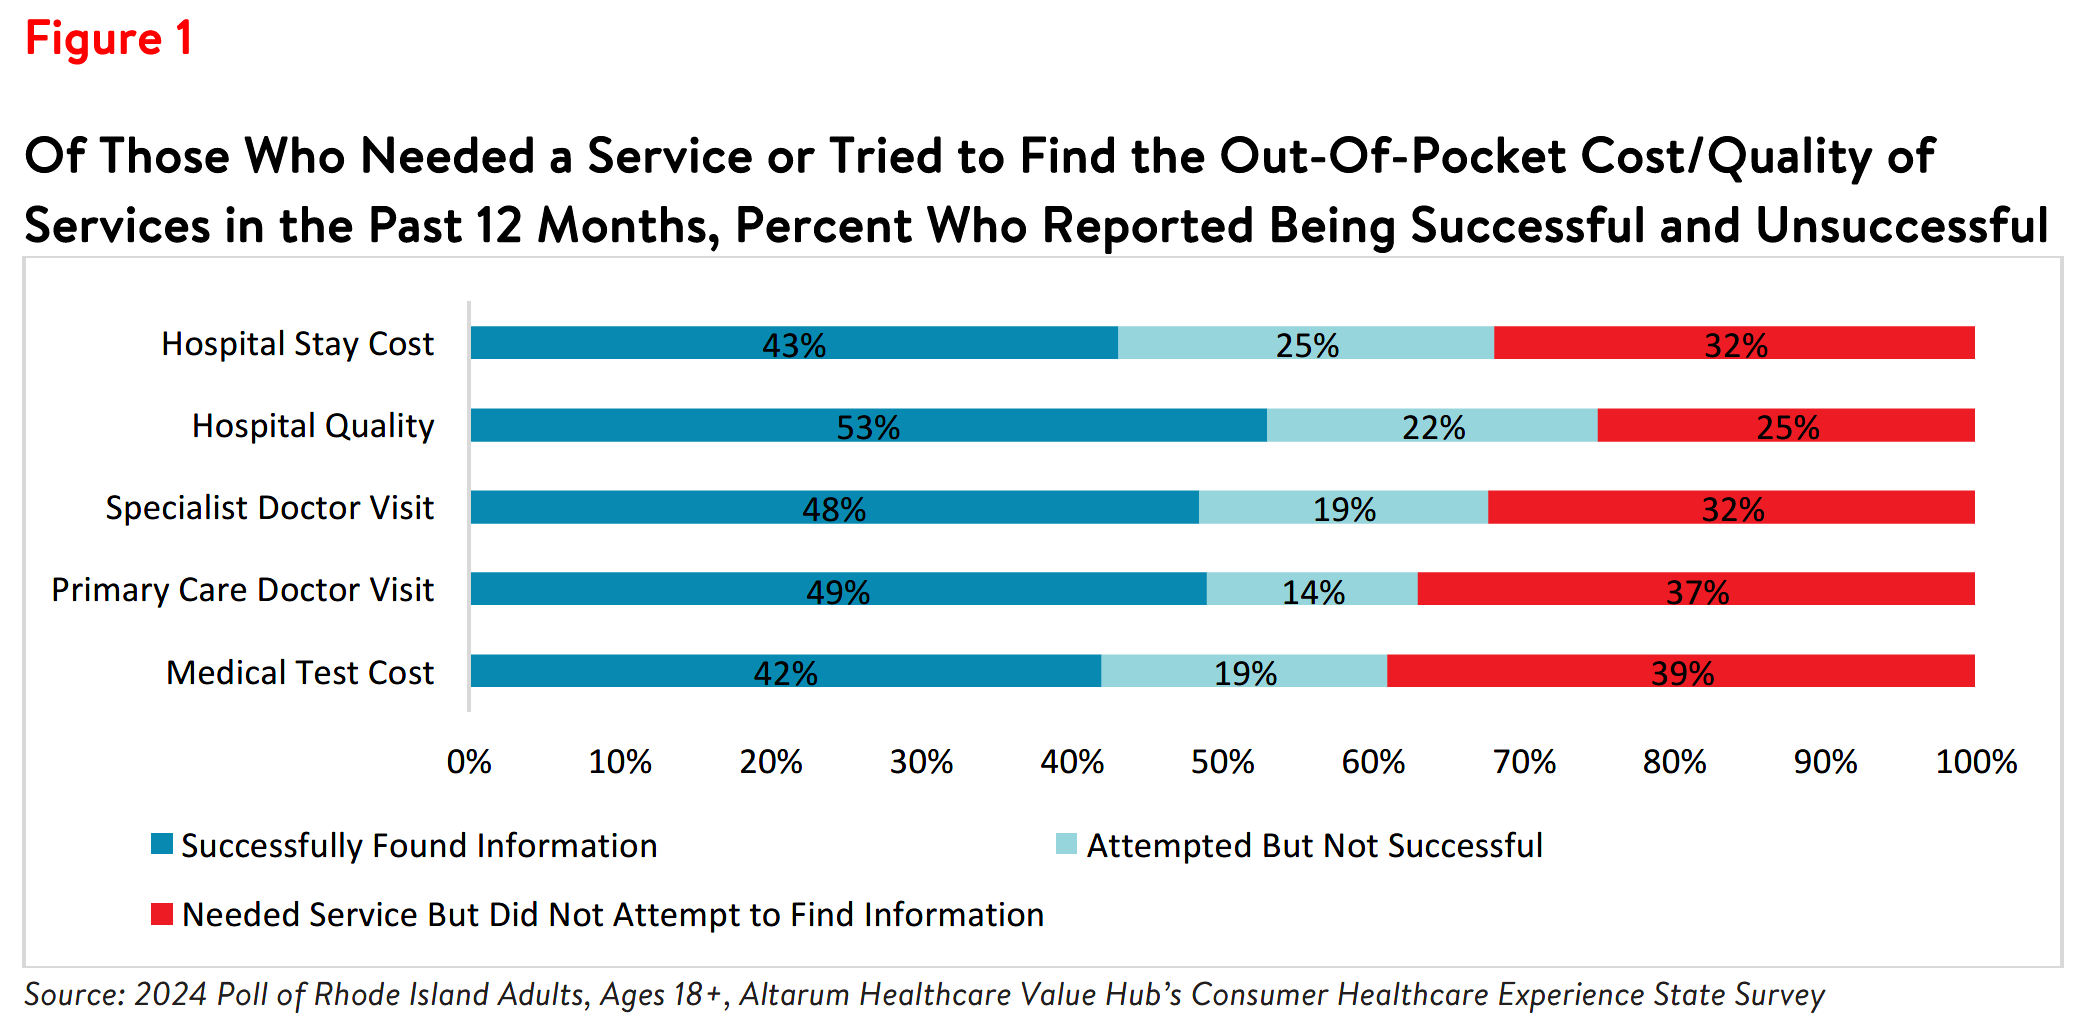
Rhode Island respondents’ lack of confidence may be reflected in the low rates of searching for hospital
price and quality information. Out of all respondents, only 28% tried to find the cost of a hospital stay
ahead of time and 13% needed a hospital stay but did not search for cost information. Out of those
respondents who tried to find hospital cost information or needed a hospital stay, 43% reported finding
the information they were looking for, 25% reported they did not find the information they were looking
for, and 32% did not attempt to find information when they needed a hospital.
Thirty-nine percent of all respondents reported that they have tried to find quality information on
hospitals and 13% needed a hospital but did not try to look for quality information. Out of those
respondents who tried to find hospital quality information or needed a hospital stay, 53% were successful
at finding quality information, 22% were unsuccessful and 25% did not attempt to find quality information
when they needed a hospital (see Figure 1). Figure 1 also captures other health care costs integral to
hospital services, including medical tests and primary care/specialist doctor visits.
Among respondents who needed a service but did not seek out price or quality information, the most
frequently reported reasons for not seeking information were:
- 36%—Followed their doctors’ recommendations or referrals;
- 27%—Looking for information felt confusing or overwhelming;
- 22%—Did not know where to look;
- 21%—Did not have time to look; and
- 15%—It never occurred to me to look for provider quality or price information.
Notably, few of these respondents reported that out-of-pocket cost or quality were unimportant to them
(7% and 5%, respectively).
Respondents who attempted to find hospital cost or quality information but were unsuccessful faced a
variety of barriers. Among those who were unsuccessful at searching for cost information, respondents
reported that resources available to search for price information were confusing (35%), their insurance
plan or provider/doctor/hospital would not give them a price estimate (26% and 35%, respectively), and
that price information was insufficient (24%). In unsuccessful searches for hospital quality information,
respondents reported that resources available to search for quality information were confusing (28%) and
that the quality information available was not sufficient (20%).
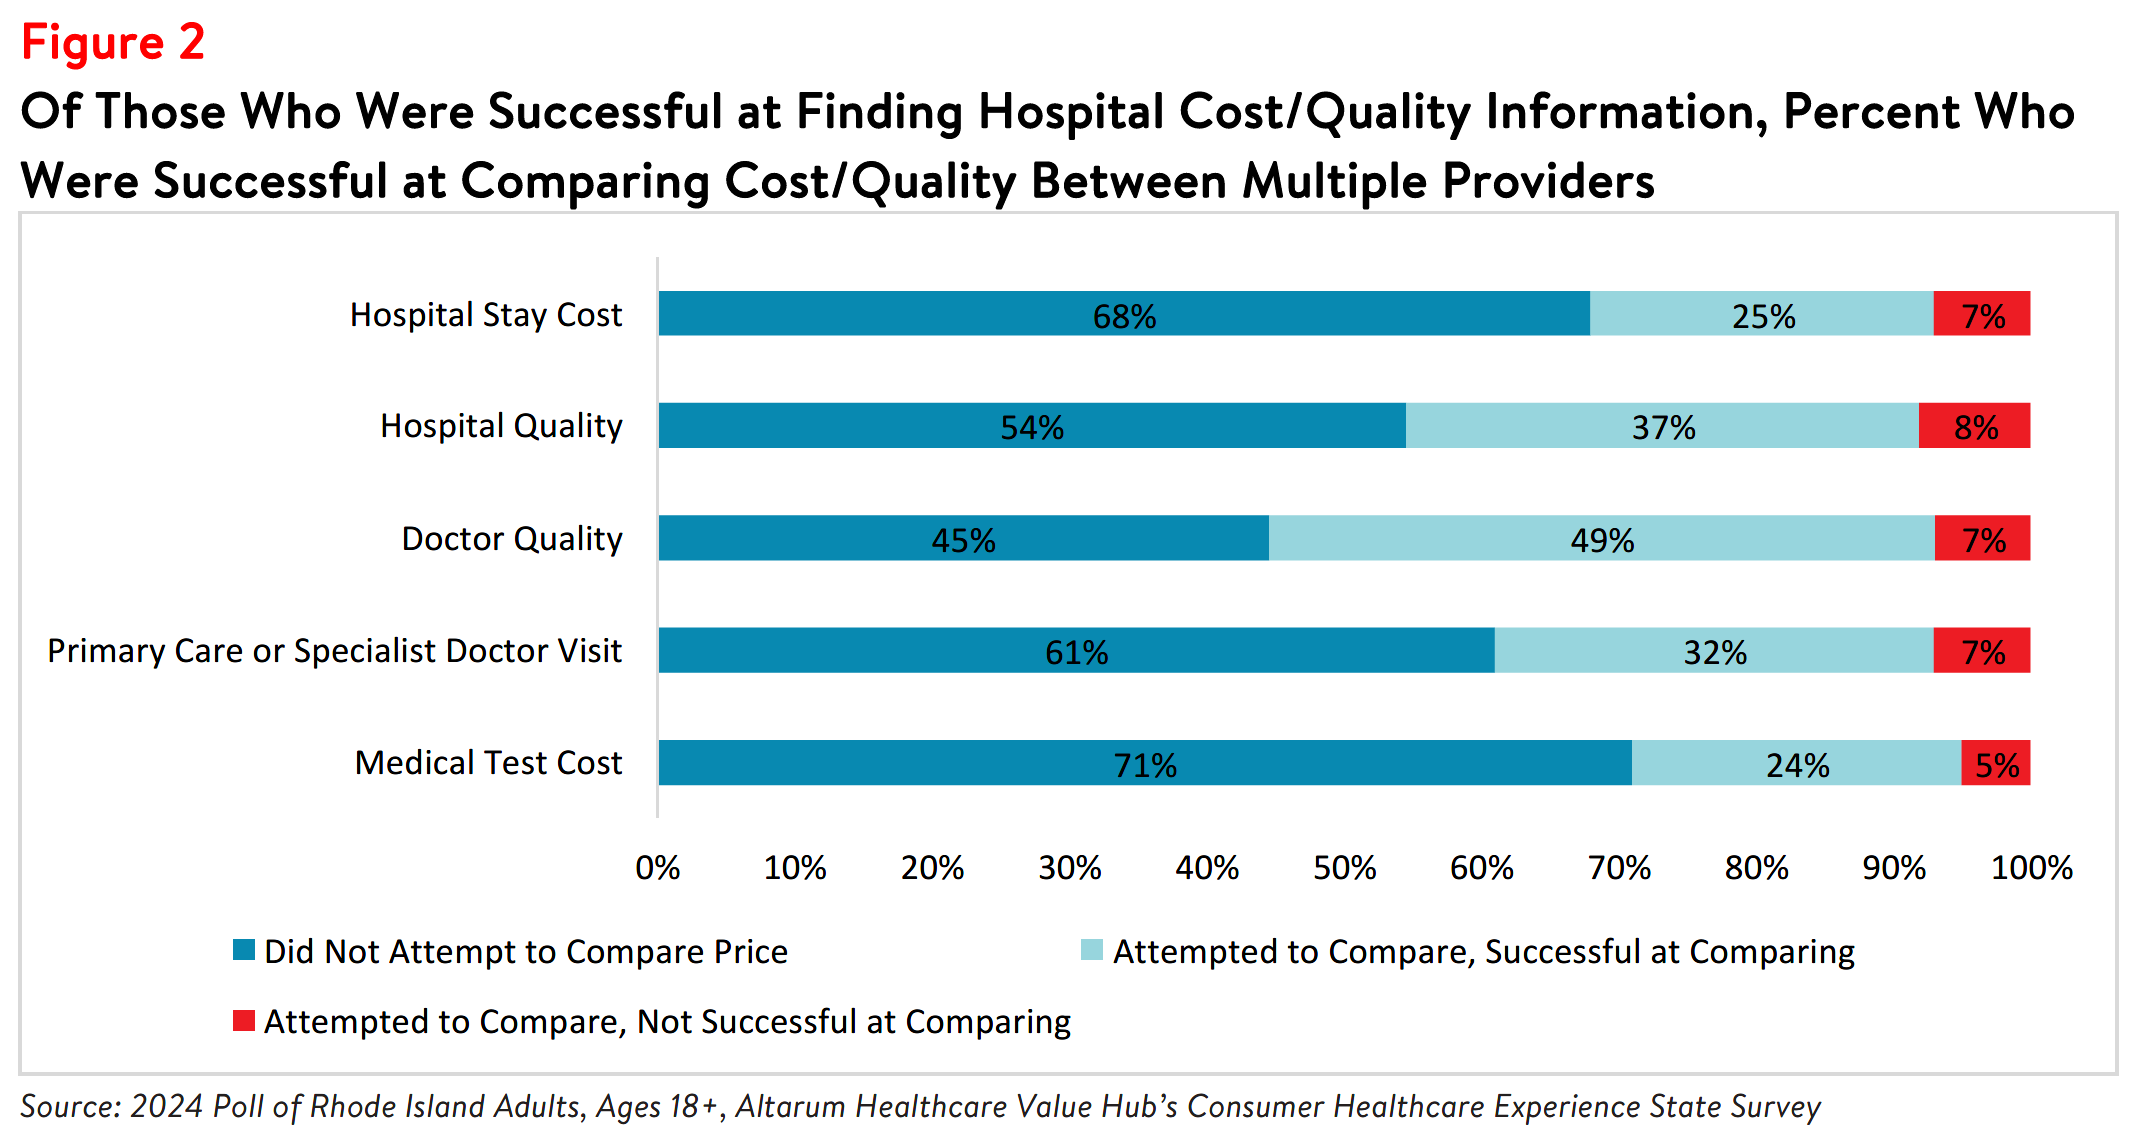
Among those who were successful at finding the cost for a hospital stay or quality information, over half
reported NOT attempting to compare prices or quality between providers (i.e., “shopping”) (see Figure 2).
Still, 25% successfully compared cost of a hospital stay, and 37% successfully compared quality across
hospitals.
Among those that compared cost or quality information for different services, many reported that the
cost or quality comparison ultimately influenced their choice of which provider to seek care from.
Seventy-six percent of those who compared primary care or specialist doctor visit costs said the
comparison influenced their choice, as did 77% of those who compared medical test costs and 66% of
those who compared hospital stay costs. Among those who looked for hospital quality information, 87%
had their choice influenced by the information.
Although many of the respondents who sought out hospital price and quality information were ultimately
successful, many respondents never attempted to find this information. Even among those who were
successful at finding hospital cost or quality information, a little over half did not compare prices or
quality between providers (i.e., “shopping”). Respondents identified a variety of barriers to finding and
comparing cost and quality information, including following doctors’ recommendations, confusion over
where or how to find cost or quality information, and providers and insurers not providing cost estimates.
These reasons could also be influenced by this information not being accessible, despite federal price
transparency mandates for hospitals.1
It could also stem from the fact that some consumers don’t view health care as a shoppable commodity,
especially in emergency situations and settings that lack a selection of treatments/providers. Lack of
knowledge of hospital quality and potential costs impedes Rhode Island residents’ ability to plan for
needed care and budget for the expense of a hospital stay, which can be costly,2 particularly for residents who are un- or under-insured.
Support for "Fixes" Across Party Lines
Hospitals, along with drug manufacturers and insurance companies, are viewed as a primary contributor to high health care costs. Out of 15 options, Rhode Island respondents most frequently cited the following as being a “major reason” for high health care costs:
- 79%—Drug companies charging too much money
- 72%—Hospitals charging too much money
- 74%—Insurance companies charging too much money
- 55%—Large hospitals or doctor groups using their influence to get higher payments from insurance companies
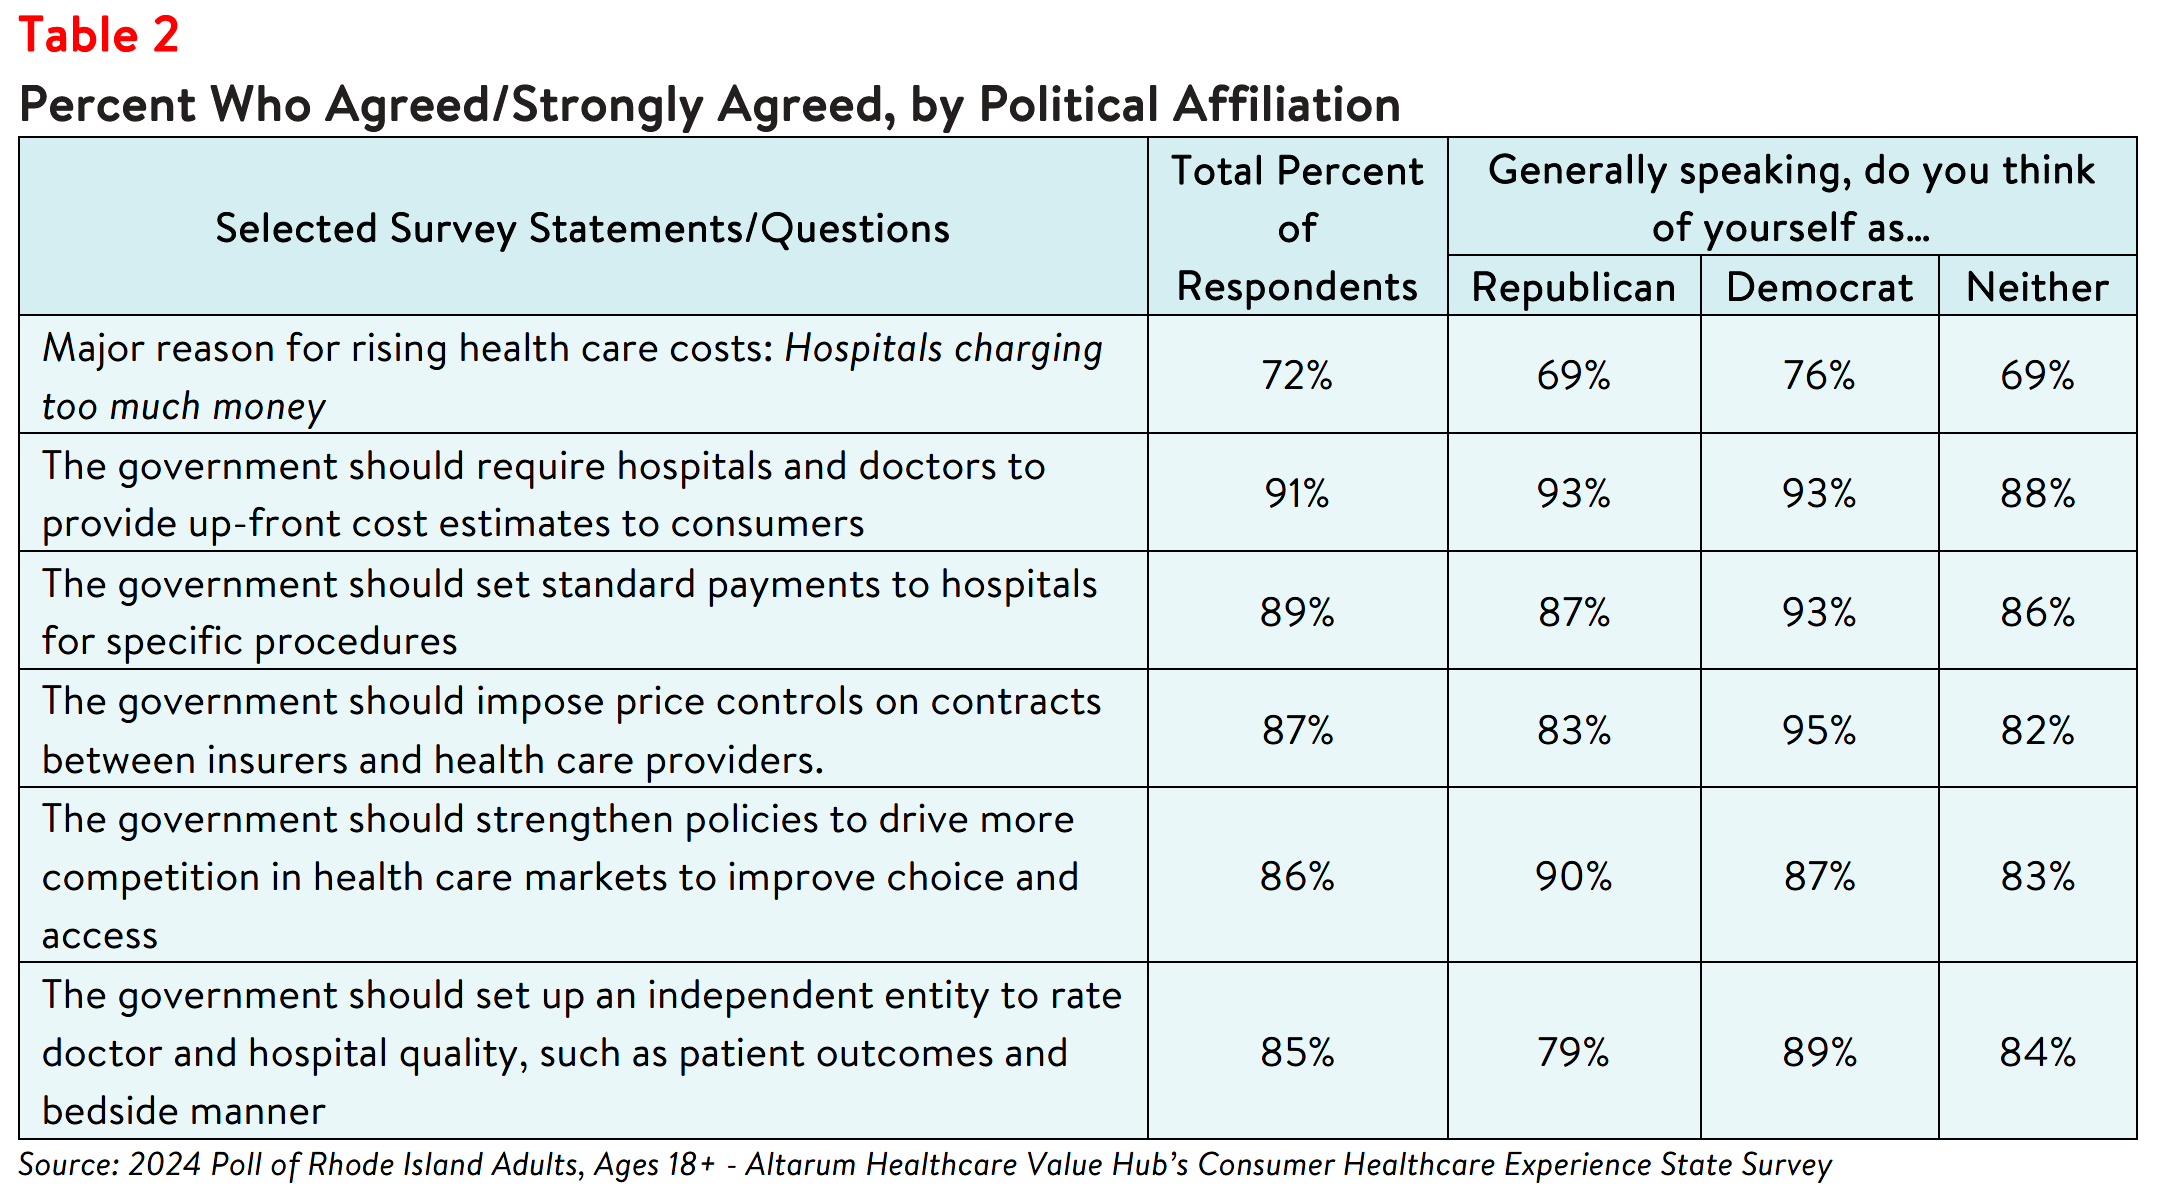
Rhode Island respondents strongly endorse several hospital-related strategies, including:
- 91%—Require hospitals and doctors to provide up-front cost estimates to consumers
- 89%—Set standard payments to hospitals for specific procedures
- 87%—Impose price controls on contracts between insurers and health care providers
- 86%—Strengthen policies to drive more competition in health care markets to improve choice and access
- 85%—Set up an independent entity to rate doctor and hospital quality, such as patient outcomes and bedside manner
What’s even more interesting is the level of support for some of these strategies across party lines (see
Table 2).
Conclusion
The findings from this poll suggest that Rhode Island respondents are somewhat motivated when it comes to searching for hospital cost and quality information to help inform purchasing decisions and plan for a future medical expense. Still, over half did not search for this information at all, suggesting that effort to influence consumer shopping through price transparency initiatives may not be effective for everyone.
It is not surprising that Rhode Island respondents express strong support for government-led solutions to
make price and quality information more readily accessible and to help consumers navigate hospital care.
Many of the solutions that respondent’s support would take the burden of research and guesswork off
consumers, such as standardizing payments for specific hospital procedures, requiring hospitals and
doctors to provide consumers cost estimates for certain procedures, and establishing an entity to conduct
independent quality reviews. Policymakers should investigate the evidence on these and other policy
options to respond to respondents’ bipartisan call for government action.
Notes
-
As of January 1, 2021, the Centers for Medicare and Medicaid Services (CMS) requires hospitals to make public a
machine-readable file containing a list of standard charges for all items and services provided by the hospital, as well as a consumer-friendly display of at least 300 shoppable services that a patient can schedule in advance. However, Compliance from hospitals has been mixed, indicating that the rule has yet to demonstrate the desired effect. https://www.healthaffairs.org/content/forefront/hospital-price-transparency-progress-and-commitment-achieving-its-potential -
According to Health Forum, an affiliate of the American Hospital Association, hospital adjusted expenses per inpatient day in Rhode Island were $3,102 in 2022, similar to the national average. See: Kaiser Family Foundation, State Health Facts Data: Hospital Adjusted Expenses per Inpatient Day. Accessed May 30, 2024. https://www.kff.org/health-costs/state-indicator/expenses-per-inpatient-day/
Methodology
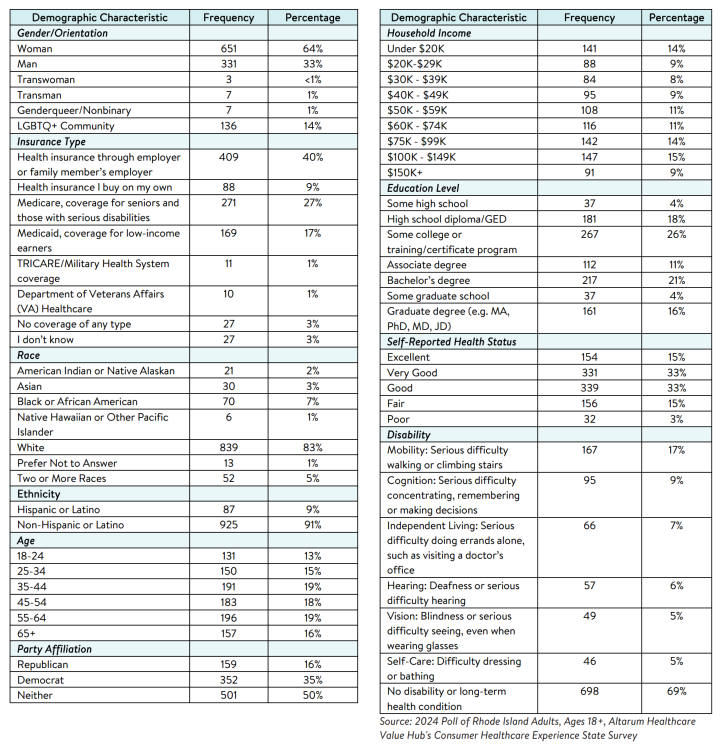
Altarum’s Consumer Healthcare Experience State Survey (CHESS) is designed to elicit respondents’ views on a wide range of health system issues, including confidence using the health system, financial burden and possible policy solutions. This survey, conducted from February 19 to March 27, 2024, used a web panel from Dynata with a demographically balanced sample of approximately 1,100 respondents who live in Rhode Island. Information about Dynata’s recruitment and compensation methods can be found here. The survey was conducted in English or Spanish and restricted to adults ages 18 and older. Respondents who finished the survey in less than half the median time were excluded from the final sample, leaving 1,012 cases for analysis. After those exclusions, the demographic composition of respondents was as follows, although not all demographic information has complete response rates:

HEALTHCARE VALUE HUB
The Healthcare Value Hub can help you find free, timely information about policies and practices to achieve health systems that are equitable, affordable, and focused on the goals and needs of the people the system is meant to serve.
Share
![]()
![]()
![]()

Follow
![]()
![]()


![]()